SilvaCloud Tutorial
SilvaCloud provides rapid and accurate stocking assessments at the forest level. Publicly available LiDAR data from opentopography.org, or data from dedicated airborne or UAV platforms can be used. SilvaCloud outputs include forest stocking levels, tree locations, canopy detection and canopy height models.
SilvaCloud gives you the information to answer the following questions:
- What is the best pre-thinning directive we can provide thinning operators?
- How can we get this information to the thinning operators to use onsite?
- How can we reduce the costs of pre-assessment and QC operations?
- How can we evaluate thinning operations at the stand level?
Read on to learn how you can use SilvaCloud .
This project has been developed by Interpine, with funding assistance from the Precision Silviculture Programme, A Sustainable Food and Fibre Futures (SFFF) partnership between MPI and the forest industry led by Forest Growers Research.
What’s New
The latest software release notes and feature availability is shown below.
| Version | Release Notes |
|---|---|
|
V2.06 (02/04/2026) |
1. Add “Target Mean Treeheight” and “Mean Treeheight tolerance” settings 2. Update the color plalette for stocking maps and tree height maps |
|
V2.05 (10/02/2026) |
1. Add Refine mode |
|
V2.04 (27/01/2026) |
1. Add Hindrance GeoPDF map 2. Add Analysis pixel type selection (Hexagon, Square) |
|
V2.03 (18/12/2025) |
1. Stocking tolerance edit available 2. Analysis Pixel Size edit available 3. Change pixel shape to hexagon 4. Add Summary.csv with stocking and tree height statistical data 5. Add summary and statistical data on geomaps |
| V2.02 (3/11/2025) |
1. Upgrade data size limit to 3 GB 2. Add coordinates system selection 3. Add Min tree height input 4. Add Target stocking input 5. Add Slope, CHM, Tree height, Stocking, Thinning, and Operational GeoPDF Maps outputs |
| Beta V2.01 (7/7/2025) | 1. Add coordinates system selection option 2. Add Minimum height selection for better outputs 3. Add output option for returning all results and input data or only analysis rasters and tree detection results 4. Output RGB raster if RGB data is available |
| Beta V1.01 (19/02/25) | Robust interface 1. Fixed sub-folder problem 2. Email reminder for AOI files missing 3. Accept filenames with spaces |
| Alpha V1 (1/1/24) | Initial release for key stakeholders testing and feedback |
Preparing Data for Upload
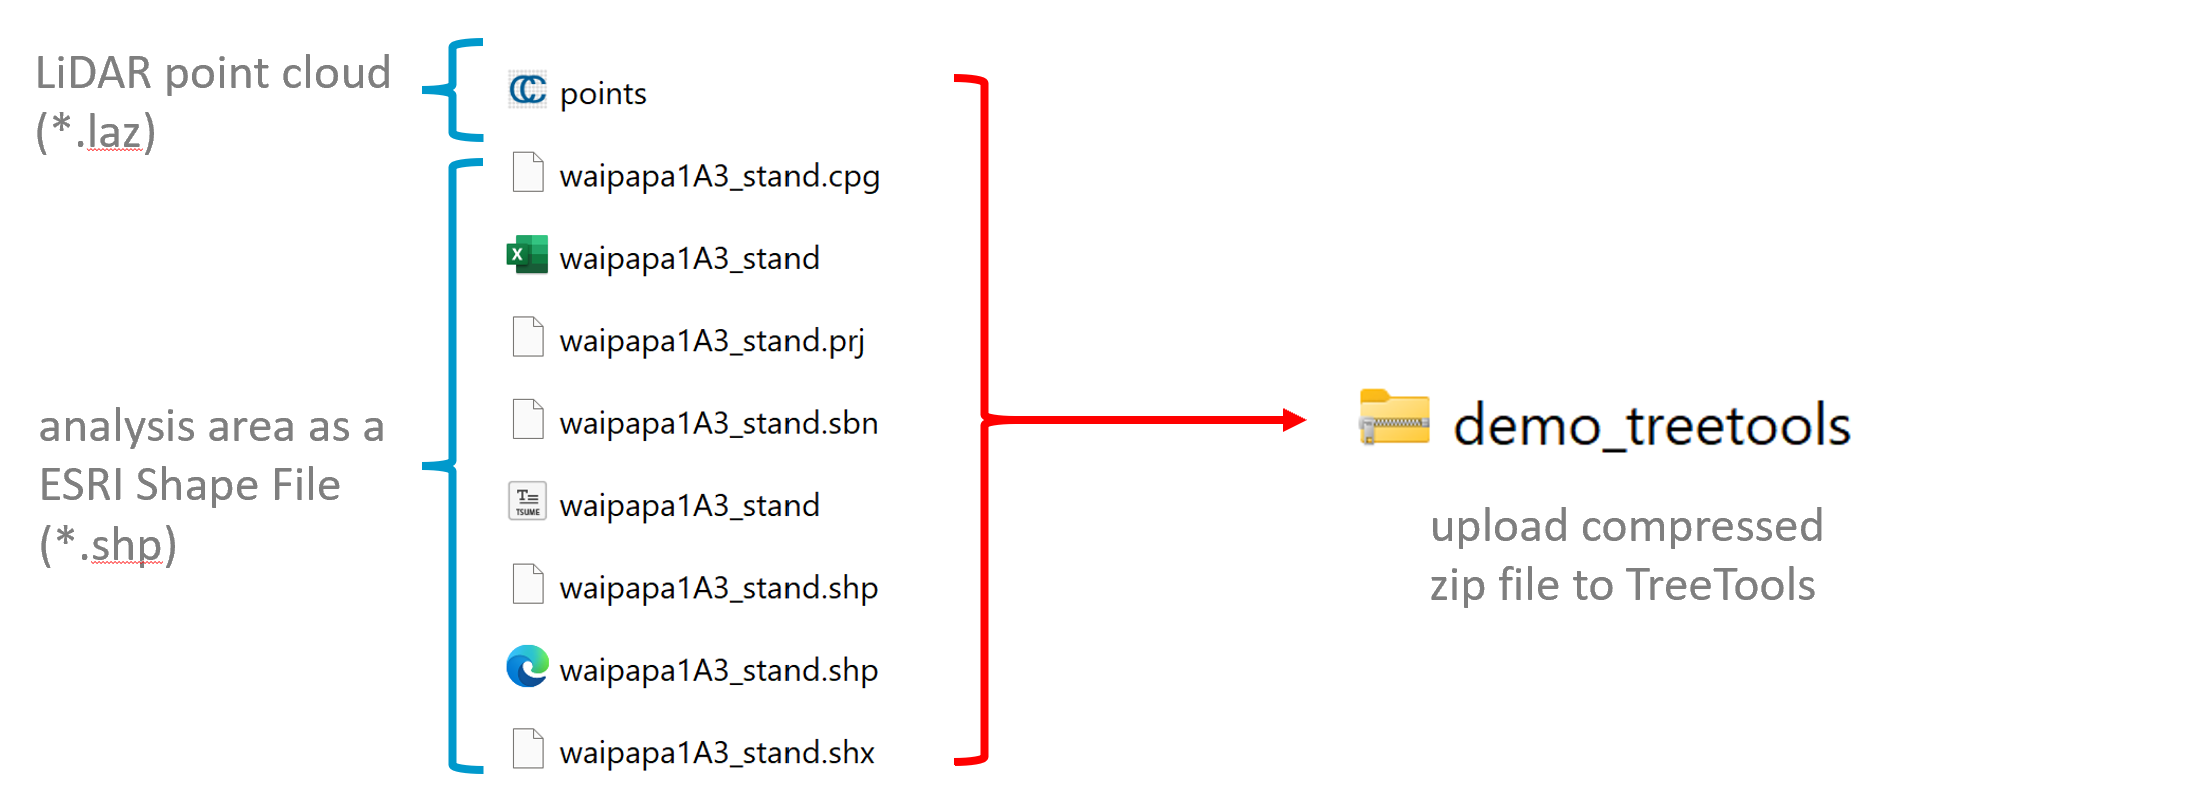
SilvaCloud requires two key inputs covering the area of interest:
- An analysis polygon (shapefile format).
- LiDAR data (laz format).
Data is uploaded to TreeTools as a compressed zip file (*.zip). Note the area of interest (AOI) is typically a stand boundary.
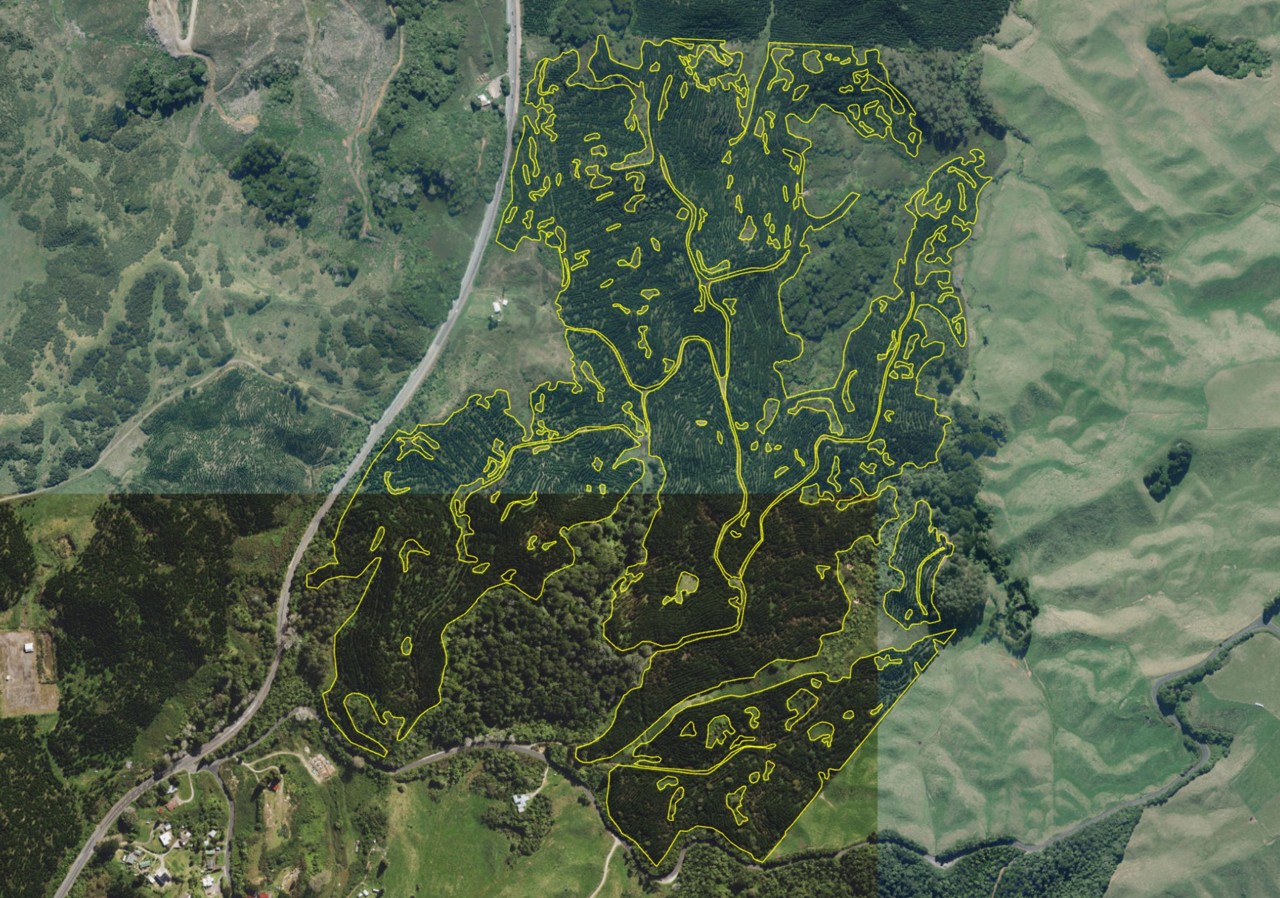
For the purposes of this tutorial we will use the stand below, which is due a pre-thinning assessment for an upcoming silviculture operation.
Download Free LiDAR Data from Open Topography
New Zealand has a national LiDAR collection program which captures publicly available LiDAR data across much of the country. This is a good place to start if you do not have your own LiDAR data. You can source this from Open Topography.
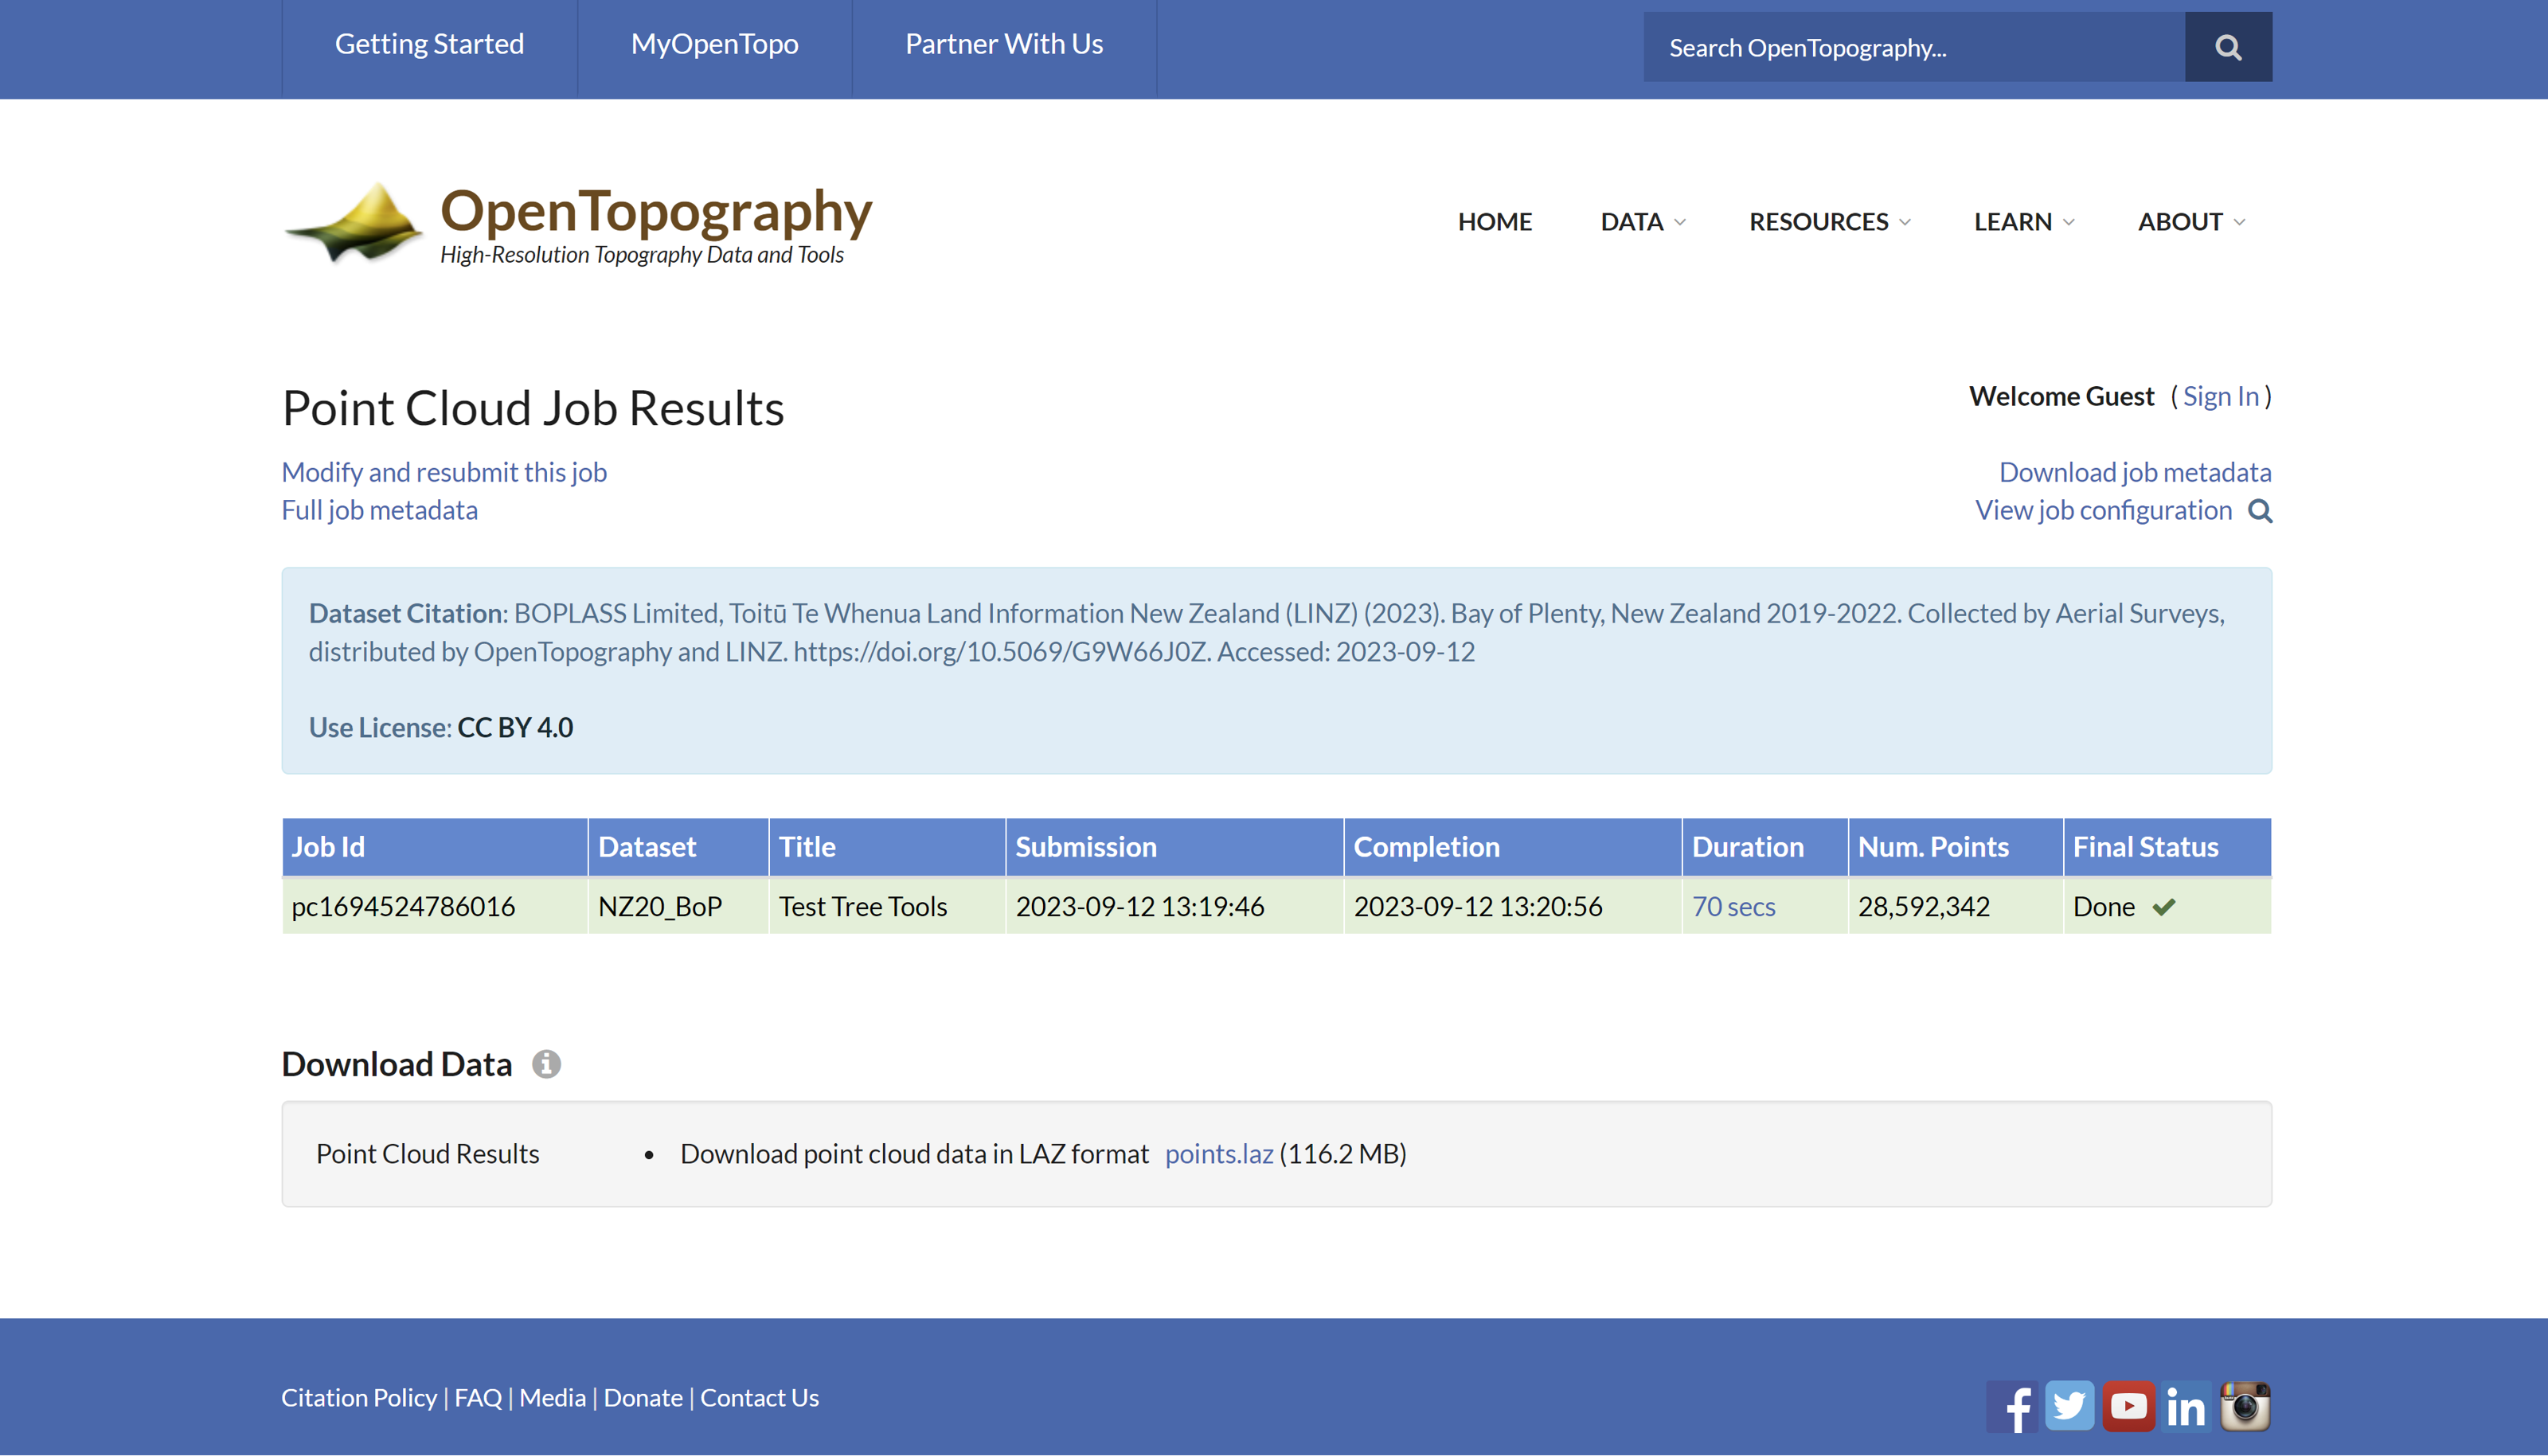
Follow the video below to locate and download the LiDAR point cloud for the stand boundary. In this example, we discover that the area has two available public datasets. We select the latest dataset to ensure we get the most up to date information for our AOI. While SilvaCloud onlys needs the *.laz file for analysis, you can download additional outputs, including a quick 3D visualization available within the browser to see the LiDAR coverage over the AOI.
Once ready, Open Topography will provide you with a link to the LiDAR point cloud file as a “points.laz” file.
If you choose to review the 3D visualization of the point cloud, you will be able to assess the quality of the point data and appreciate its usefulness for analysis.
Upload LiDAR Data for Processing
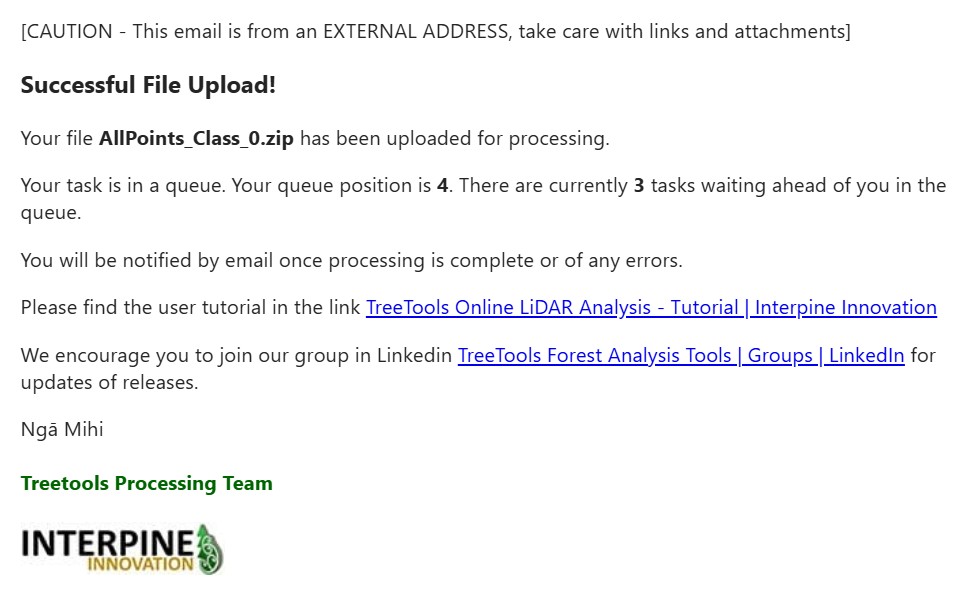
Ensure that both your shapefile and .laz file are in the compressed zip file. Enter you email address and select the compressed zip file to upload to SilvaCloud for processing.
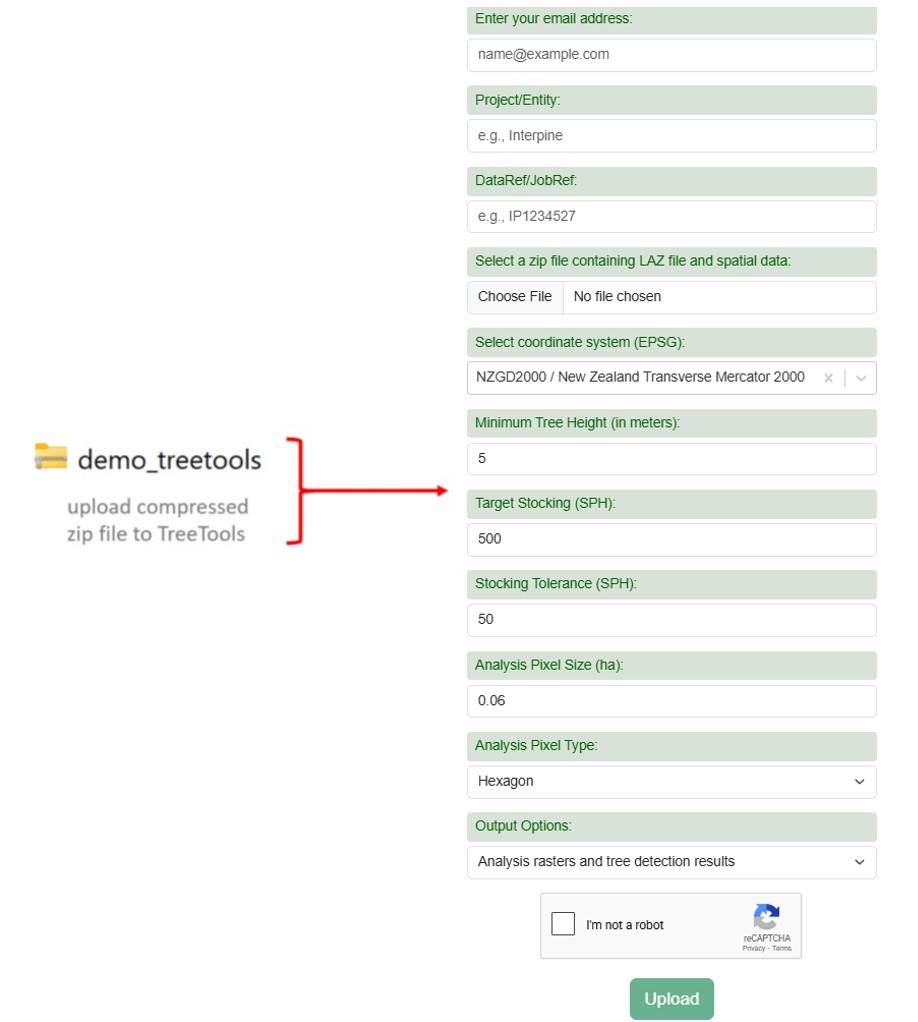
Once the file has been uploaded you will receive an email confirmation the data has been received.
Results and Outputs
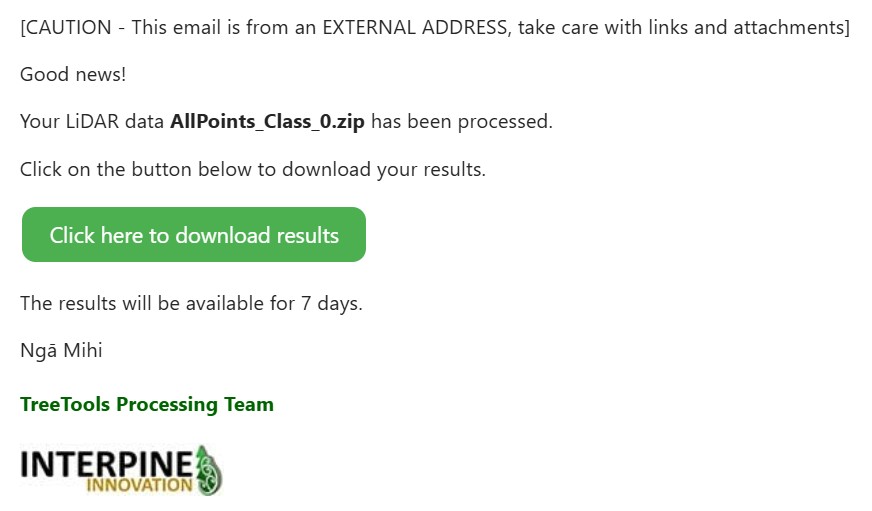
Once data is processed you will get an email with a download link to access the analysis results. These will be available for a period of 7 days before they are deleted from the server.
Below is a list and description of outputs you will receive from SilvaCloud.
| Output / Folders | Description |
|---|---|
| 00_IncomingData | This is your data you uploaded for analysis. You will find your LAZ data and related area of interest shape file. This is an optional output if you select to receive all data back from the server. |
| 01_ClassifiedPoint | Output LAZ file classified into classification point classes. This is an optional output. |
| 02_NormaliseHeight | Output LAZ file normalized by class 2 ground points. This is an optional output. |
| 03_Digital_Elevation_Model | Digital terrain model, provided in several formats including a hillshade. |
| 04_Canopy_Height_Model | Canopy height model at 0.3m resolution. This is created using Pitfree |
| 05_TreeTops_Crowns | Crowns Tree Tops SPH and Height Summary |
| 06_AerialImagery | This provides an aerial image generated from colorized LiDAR point clouds. If a colourised point cloud is not detected an output image will not be created. |
| 08_FileLists | This provides a text file containing the list of tiles for classified data, normalised data and denoised data. |
| 09_QualityControl |
An overview shapefile for the classified dataset Reports the contents of the header and a short summary of the points Scan angle rank text file Information about the flight overlap; flight coverage |
| 10_Maps | It contains various GeoPDF maps and a summary.csv: Summary.csv |
Refine Mode
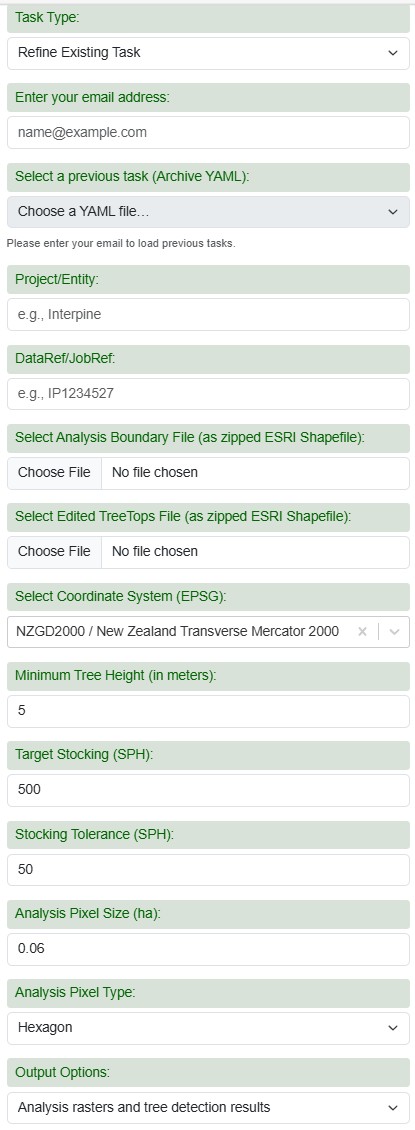
Under Task Type select “Refine Existing Task”. Then input your email address to search your existing tasks for refining. You could modify your previous settings to regenerate the maps. You could also update a new boundary file, or upload TreeTops ESRI Shapefile cleaned manually to generate more accurate Geomaps.
Further Support
For support use our contact form to reach out. Thanks for using TreeTools.