Interpine’s TreeTools VirtualPlot Forest Inventory tool has been developed to enable foresters to assess tree stocking in their forests. Using a drone to capture imagery over your forest, you can then create virtual plots to calculate your stocking.
You can expect to calculate stocking estimates within 1-3% accuracy when using a DTM for analysis and 10% when analyzing without a DTM.
The following provides an overview for data capture and a guide to using the software.
Drone Support
A list of currently supported drones and sensors is provided below. Interpine has completed calibration of a drone’s camera sensor field of view (FoV) in our test environment on all platforms below, therefore using VirtualPlot with these drones will provide optimal results. Where custom calibration has not been completed, VirtualPlot will still provide results based on the manufacturer’s FoV specifications. These results may not be optimal but may still be suitable for many applications.
If you have a specific drone or camera sensor you would like supported with a custom calibration, please reach out to the team.
- DJI Phantom 4 Pro
- DJI Phantom 4
- DJI Mavic Air
- DJI Mavic Pro
- DJI Mavic 2
- DJI Air 2S
- DJI Mini 4 Pro
- DJI Mavic 3 Enterprise
- DJI Mavic 3 Multispectral
- DJI Mavic 3T Wide/Zoom camera
- DJI Matrice 4E
- DJI Matrice 4D Wide/Zoom cameras
- DJI Zenmuse H20 / H20T- RGB Sensor
- DJI Zenmuse L1 LiDAR – RGB Sensor
- DJI Zenmuse L2 LiDAR – RGB Sensor
- DJI Zenmuse P1 24mm, 35mm RGB Sensors
- DJI Zenmuse H20/H20T zoom camera
- DJI Zenmuse H30/H30T zoom camera
What’s New
The latest software release notes and feature availability is shown below.
| Version | Release Notes |
|---|---|
| 2.21 (19/6/2026) | 1. Support DJI Zenmuse H30/H30T zoom camera 2. Support DJI Matrice 4D Wide/Zoom cameras 3. Support DJI Mavic 3T Wide/Zoom camera |
| 2.18 (2/3/2026) | 1. Add AI detection model for Radiata chemical thinning ALPHA. For more information on this model release: Introducing Chemical Thinning (eThinning) AI in Virtual Plot – ALPHA Release | Interpine Innovation |
| 2.17 (25/2/2026) | 1. Allow maximum 10 times Zoom-in rate for Refine mode. This aids those editing and detecting smaller objects. 2. Rename AI models, to create a systematic naming structure as we continue to add more AI models to Virtual Plot. This is also updated in the model information within this Tutorial: Tutorial VirtualPlot – TreeTools > Selecting the AI Tree Detection Model |
| 2.16 (2/2/2026) | 1. Add DJI mini 4 pro – 48mp mode (FC8482_6.72_8064X4536). 2. Add “VerifiedUnStocked” and “InvasiveWeedsPresent” layout on image output |
| 2.15 (29/1/2026) | 1. Add “No AI Detection” model 2. Add “VerifiedUnStocked” and “InvasiveWeedsPresent” checkboxes to all models |
| 2.14 (22/1/2026) | 1. Add target stocking and stocking tolerance input which provides a summary percentage within, below and above tolerance in summary.csv 2. Add support for DJI Matrice 4D 3. Add certified digital code signature to the software release cycle. This verifies identity and ensures software integrity, building user trust by preventing security warnings, confirming the code hasn’t been tampered with, and allowing operating systems to recognize it as safe and authentic from Interpine Group Ltd as a known publisher. |
| 2.13 (9/1/2025) | 1. Add editable Plot Size input |
| 2.12 (8/1/2025) | 1. Added v1 of the “Hardwood Regen Assessment” Ai model. Implemented to comply with NSW CIFOA Protocol 37 for Regeneration and Stocking. For more information on the model see below. 2. Improve “Refine” interface: Add zoom in/out function, display attributes on right side, and add comment editing 3. Fixed Output.kmz updating issues in Refine |
| 2.11 (4/12/2025) | 1. Output.kmz file is compatible with Avenza Maps and can be imported directly 2. Add “Assumed AGL” checking function while DTM available 3. The plot size remains constant throughout the process 4. Update Post-Thinning Model to Radiata pine Thinning Model v8 5. Drop Video and Stream functions 6. Make the interface size smaller |
| 2.10 (19/09/2025) | 1. Add boundary option to enable images selection in stand 2. Add a refining module for manually tree detection correcting |
| 2.09 (11/08/25) | 1. Refined the parameters for better virtual plot size estimates 2. Update Post-Thinning Model to Radiata pine Thinning Model v7 3. Update Age 1-2 model to Radiata Pine Age 1-2 Model v2 4. Update Age 3-4 model to Radiata Pine Age 3-4 Model v2 5. Refine DTM format interface |
| 2.08 (06/06/25) | 1. Change Virtual Plot algorithm methodology for conveniently adding more camera types. 2. Add confidence parameter setting into “3. AI Detection Parameters” module. It could be useful for controlling missing tree and false positive problems. 3. Split “Early age assessment” model into two separate models: “Age 1-2 assessment” and “Age 3-4 assessment”. The former is for age 1-2, and the latter is for age 3-4. 4. Update Post-Thinning AI Model to Radiata pine Thinning Model v6. 5. Move “Tree Height est.” parameter into “1. Dataset Parameters” module. |
Earlier Software Update Details
Previous updates / releases of TreeTools Virtual Plot.
| Version | Release Notes |
|---|---|
| 2.07 (19/05/25) | 1. Update Early Age Assessment AI Model for including younger trees like age 2. (Radiata pine Early Age Model v3) |
| 2.06 (09/05/25) | 1. Update Post-Thinning AI Model with more training data. (Radiata pine Thinning Model v5) 2. Improve the interface for “DTM Converter” |
| 2.05 (28/03/25) | 1. Fix an error of AGL calculation using take-off photo on 2.03/2.04. NOTE: The outputs using take-off photo could be wrong in 2.03/2.04. Please update to at least this version for a correct take-off photo + DTM function. 2. Allow NZTM NZVD2016 DTMs. Select “Vertical Datum” after uploading DTM. The default value is “NZVD2016” for the convenience of NZ users. Currently it supports both NZVD2016 and Ellipsoidal vertical datums, and the horizontal coordinates could be NZTM2000 or WGS84. 3. Add “DTM Converter” function in “Tools” menu beside “Help” for converting NZTM NZVD2016 DTMs to WGS84 Ellipsoidal, which could be useful for DJI flight planning. 4. Update Post-Thinning AI Model with more training data. (Radiata pine Thinning Model v4) |
| 2.04 (5/03/25) | 1. Improved user interface for image processing workflow. 2. Inclusion of DTM and Take-Off image names if loaded for use, into the results.csv file. (28/03/2025) NOTE: The outputs using take-off photo could be wrong in this version. Please update to at least 2.05. |
| 2.03 (28/02/25) | 1. Add a function of using take-off photo + DTM to determine AGL for drone types not supporting recording of height above ellipsoid and only height above take off point, like DJI Phantom 4 Pro, DJI Mavic 2, etc. The take-off photo has to be taken at the take-off point with the drone on the ground. (28/03/2025) NOTE: The outputs using take-off photo could be wrong in this version. Please update to at least 2.05. 2. Update calibration parameters for DJI L2 LiDAR – RGB Sensor and DJI Mavic 3 Multispectral, which are also supported by the DTM function. 3. Update Post-Thinning AI Model with more training data. (Radiata pine Thinning Model v3) 4. Update Early Age Assessment AI Model with more training data. (Radiata pine Early Age Model v2) |
| 2.02 (20/01/25) | 1.Update calibration parameters for DJI L1 LiDAR – RGB Sensor. |
| 2.01 (19/12/24) | 1. Improve the interface to make it more user-friendly. Added video processing function and stream processing function. 2. Both video process and stream process need to choose drone type first. The video process is designed so that you can figure it out how to use it at a glance. Click “Save” button to save the current result and click “Exit” to terminate the process and a Summary.csv will be generated. 3. For real-time stream process, before clicking “GetIP” button your computer and your drone’s controller need to be in a same Local Area Network (LAN). The practical way of doing this is to turn on your phone’s hotspot and connect both your computer and your drone’s controller to the hotspot. It doesn’t need your phone has to catch signal in field. After connecting successfully, click “GetIP” button and the RTMP address will be printed on the right-side console window. Then type it to your drone controller and start streaming. The video stream will be pushed to your computer. Select the correct drone type and click “Video Stream Go” button. You should see the real-time inference result comes up. Fly your drone to look around. Click “Save” button to save the current result at any time and click “Exit” to terminate the process and a Summary.csv will be generated. |
| 1.04 (6/12/24) | 1. Updated the post-thinning model. 2. Added a function of using DTM to obtain flight height smartly and more precisely. Now the DTM method only supports DJI Mavic 3 Enterprise and DJI L1 RGB Sensor. The best DTM should be 1m tiles, and the coordinate system has to be WGS84 + Ellipsoidal Height. |
| 1.03 (15/11/24) | Added a new column ‘PlotsToReach10PctPLE‘ in ‘Summary.csv’ to suggest how many plots are needed to reach 10% PLE. |
| 1.02 (11/11/24) | Added a KMZ output, where all output results can be easily opened in Google Earth Pro. |
| 1.01 (5/11/24) | Initial beta release for testing and development purposes. Currently supported drones are the DJI Phantom 4 Pro, Mavic 2, Mavic 3 Enterprise. |
Capturing Data with Your Own Drone
The following guidelines will help you in capturing data for use with TreeTools VirtualPlot.
Please follow the suggested flight parameters below for data collection.
| Flight Parameter | Suggestion |
|---|---|
| Flight App | A range of apps are suitable for VirtualPlot data collection. It is vital that the app supports terrain awareness / terrain following. Maps Made Easy – Tag Pilot, for DJI Mavic 2, DJI Phantom series drones. Maps Made Easy – Map Pilot Pro, for the DJI Mavic 2, DJI Phantom series drones. DJI Pilot 2, for the DJI Matrice series, DJI Mavic 3 Enterprise drones. UgCS, for more complex flight planning. |
| Flight height above ground level | 100-120 m. Flying at 120m is optimal as this results in a larger plot size, which produces better results. |
| Flight speed | Between 8 – 12 m/s. The key is reducing motion blur in the imagery to keep good tree detection quality. – If windy consider 8-10 m/s to reduce motion blur in moving trees. – If calm 10-12m/s should be fine. |
| Terrain Awareness | Terrain Awareness is required so that the drone maintains a constant height above ground during the flight. Using Tag Pilot terrain AGL lock mode. Using Map Pilot terrain follow mode. Using DJI Pilot 2 and need to create a GeoTIFF DTM file to load, follow this article. Using UgCS terrain follow mode. Using DJI Pilot 2 Real-time Terrain Follow |
| For Drones Only Reporting Height Above Take Off Point | For users of the DJI Phantom series, DJI Mavic 1 and 2, which only record height above take off point within each photo (not height above WGS84 ellipsoid), we recommend taking a photo on the ground at the takeoff point. This can then be uploaded during processing together with the DTM to provide precise plot area measurements. See how this is used during processing. If your using Maps Made Easy Map Pilot, this software takes a ground image for you. |
| Terrain Conditions | In rolling to steep terrain, you will get optimized results by adding a DTM during processing. Find out more here. |
| Gimbal Pitch | 90 Degrees (looking straight down). Images too far outside this range will not be processed. |
| Lighting conditions | Sunny or Cloudy – detection algorithm trained on a range of lighting conditions. |
| Overlap | Dependent only on the required plot intensity across the flight area. Work out how many plots you require and use the overlap to target the corresponding number of images. Often this can be much less than 50% overlap. If you need to increase the number of plots / images taken, increase the forward overlap first. |
Video Tutorial
Getting Started – the Basics of VirtualPlot
A quick start video to get you up and running using the image processing workflow.
Using Digital Terrain Models to Enhance Results
You can now use a DTM to improve the results, especially in steep terrain. This works for all supported drones types.
Get Started
Download, Open and Activate License
After subscription, a software download link and license key will be sent to your registered email address. Download the software by clicking the download link, then double click and input the license key. The software does not require any installation and can be run directly from the application file downloaded.
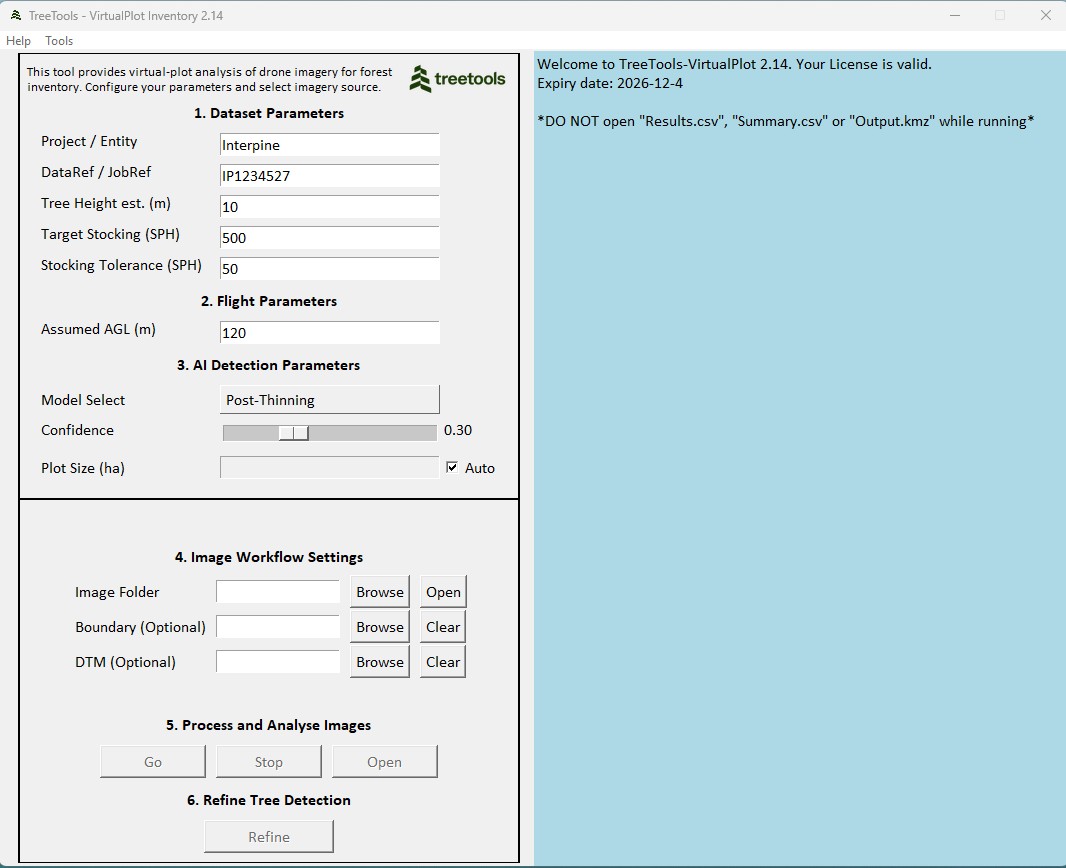
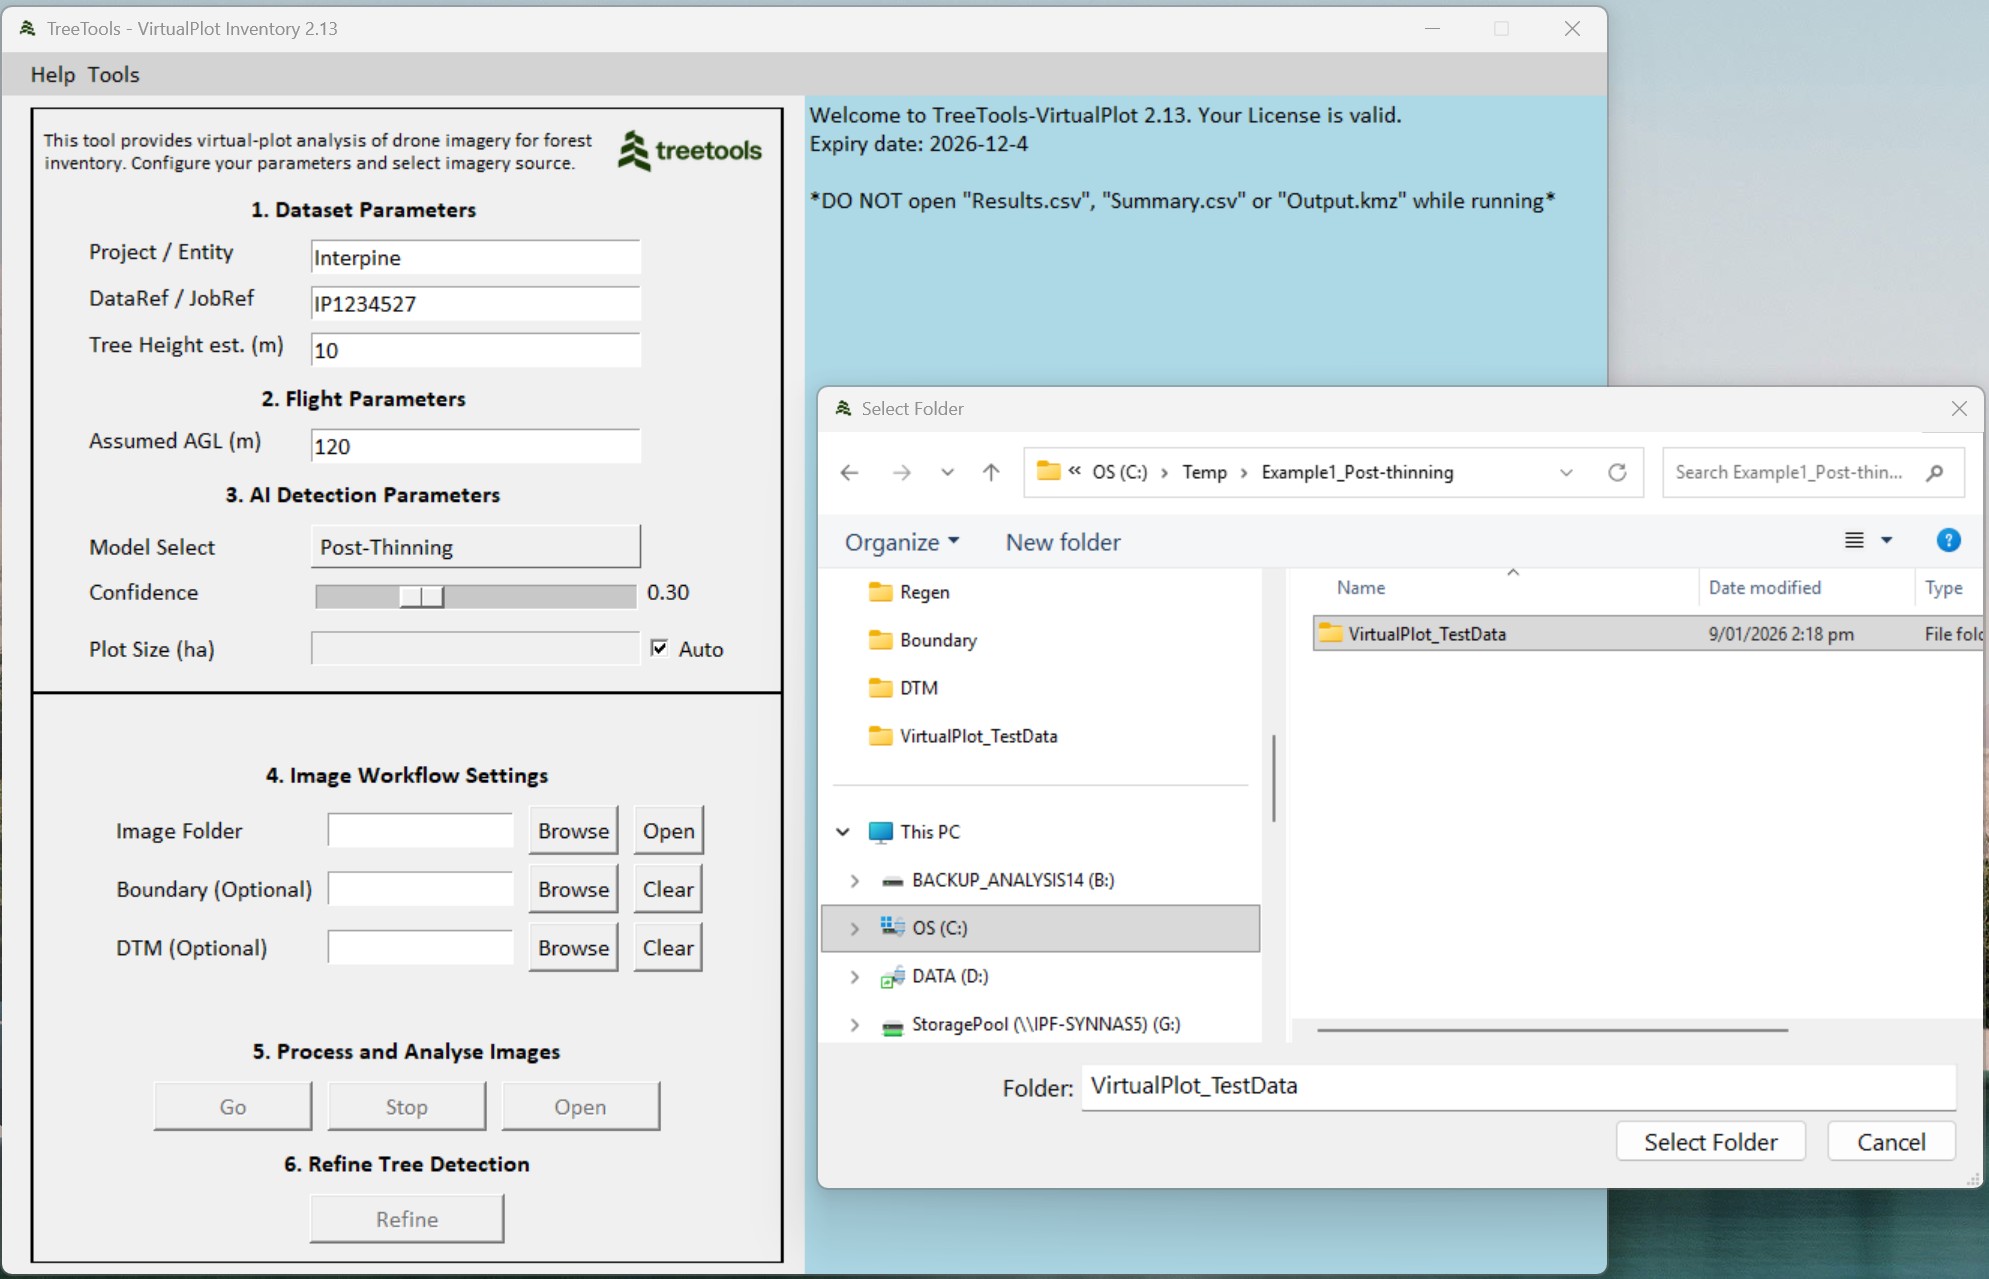
The following GUI will appear.
Set Initial Parameters
Initial parameters allow you to define the analysis project.
| Parameter | Description / Use |
|---|---|
| Project / Entity | A reference for your own use. This is output in the final data and can be used to link the data back to a client name, project, forest-compartment-stand for example. e.g. MATA-101-3 |
| DataRef / JobRef | A reference for your own use. This is output in the final data and can be used to link the data back to a specific job, contractor, operator for example. Useful to make this the Job Number from GeoMaster is using the inventory import function. e.g. J10234 |
| Tree Height est (m) | The average tree height roughly estimated for the target area in meters. This is used to approximate the distance from the drone to the treetops based on the assumed AGL. Therefore, the plot area is calculated at the treetops rather than ground level, as the detection algorithm considers the treetops are the inclusion/exclusion criteria for stocking counts. Typically, just an estimate +/- 5m would be fine. e.g. 10 |
| Target Stocking (SPH) | This is the target stocking that is desired from the inventory. This will be compared to the reported Trees Per Hectare provided by Virtual Plot and reported on within the SUMMARY.CSV, where the percentage of plots above and below the target stocking and outside of the stocking tolerance will be reported as a percentage of the total plots. |
| Stocking Tolerance (SPH) | This the tolerance which will define low or high stocking. Thresholds are established and defined as; Target Stocking – Stocking Tolerance = StockingLowPct; and Target Stocking + Stocking Tolerance = StockingHighPct. |
| Assumed AGL (m) | Assumed flight height above the ground (AGL) in meters. This should be set to the altitude used for the terrain following AGL used during flight operations. Can be approximate if also planning to analyze using a DTM (digital terrain model) as the DTM will be used to further refine the analysis when made available. e.g. 120. “Assumed AGL” also influences the virtual plot size as using DTM or DTM+Take-Off functions. Bigger Assumed AGL for larger virtual plot. |
| Model Select | This is the AI model which will be used to detect the trees. e.g. Post-Thinning Radiata Pine. If there is no suitable AI model for your crop type, then users can select to not apply any AI detections but still calibrate the imagery for use of the REFINE tool for manual detections. |
| Confidence | The confidence adjustment could be useful for controlling missing tree and false positive problems. Lower confidence could help decrease missing trees. Higher confidence could help remove false positives. Default recommended setting is provided, but users can tweak to revise the Ai detection to suit your data. |
| Plot Size (ha) | The default is the maximum plot size permitted by the flight parameters. Higher AGL means larger plot size permitted. Unselect “Auto” checkbox to activate plot size edit. An error will be displayed if the selected plot size is not compatible. If you wish to fix a certain radius plot, then you can work out the area of the plot required using plot size (ha) = (pie * radius (m) 2) / 10,000. Example for an 8m radius being (3.14159*82)/10000 = 0.0201 ha. |
Selecting the AI Tree Detection Model
The performance and precision of any AI model depends heavily on the breadth and quality of its training data. We recommend testing multiple models to identify the best fit for your specific crop type, stand conditions, and silvicultural operation.
For example, if the “Age 3–4 Radiata Pine” model produces excessive small false detections, switching to the “Post-thinning Radiata Pine” model often yields improved results. Even if the imagery is not “post thinning” this might still be suitable for your dataset.
TreeTools continually enhances its model library through collaboration with end users. We actively incorporate new training data contributed by the community to develop or refine models for additional species, age classes, and operation types (e.g., pre- or post-thinning). If you have relevant imagery and labels to contribute, please contact us—we welcome partnerships to expand coverage.
Model Maturity Stages
The following staged approach is applied to model releases; ALPHA → BETA → PRODUCTION—ensuring models are rigorously evaluated and improved before full production release.
- ALPHA or BETA suffix: Early-stage models released for user testing and feedback. These are trained on a limited set of images and annotations, so results may vary and require careful validation.
- No suffix (Production): Mature models trained on a substantially larger and more diverse set of labelled images, delivering greater reliability within the defined scope (species, age range, and operation type).
Published AI Models
Additional AI model version release details are available in Virtual Plot release notes. AI model version is also provided in the AIModel field in the RESULTS.CSV.
| Model Name | Model Description |
|---|---|
| No AI Detection | “No AI Detection” model will only calibrate and draw a virtual plot with a given size without any AI detection. This allows users to use “Refine” module to do identification manually. |
| Radiata Age 1-2 Assessment | Species: Radiata pine. Age 1-2 years. This model optimises the resolution and plot size for smaller trees. Plot size will be limited at most to 0.03 ha to optimise AI enhancement of smaller seedlings. Users can still select a custom plot size below that is provided as a warning if prompted. Detection in dense glass or weed infested areas maybe challenging, but users can still use refine tree detection to make any manual edits as needed. The model has been trained on areas where spot spraying or blanket area spraying has been conducted and is suppressing weed and grass around the seedlings. There is also benefit in capturing data on either side of mid-day sun, as the model can be assisted by the shadow cast by the tree. |
| Radiata Age 3-4 Assessment | Species: Radiata pine. Age 3-4 years. This model optimises the resolution and plot size for smaller trees. Plot size will be limited to optimise AI enhancement of smaller seedlings. Users can still select a custom plot size below that is provided as a warning if prompted. Trees would be clearly visible. Detection in dense non-crop weeds such as gorse or broom maybe challenging, but users can still use refine tree detection to make any manual edits as needed. The model has been trained to also pick up a mix of smaller trees, alongside the normal crop trees (which might be suppressed growth on skid sites or compacted soils or regenerating trees. If you get too many small tree false detections, tweak the AI confidence level or try the Radiata Age 5-10 model. |
| Radiata Age 5-10 Post-thinning | Species: Radiata pine. Ages: 5-10 years. This model has mostly been trained for use for post thinning silviculture operations but could also be used successfully for pre-thinning assessment in these age ranges. Detection may not perform well in pre-assessment when the forest has reached full canopy closure and therefore miss some supressed trees not visible from above the canopy. It has been trained on a range of images including waste thinning, production thinning, and preassessment where full canopy closure is not yet occured. |
| Radiata Age 5-10 Post-Chemical-thinning | Species: Radiata pine. Ages: 5-10 years. This model is trained on both post-thinning and chemical thinning data. It only identifies live trees and ignores dead trees. |
| Hardwood CIFOA Regen Assessment | Implemented for use with Australian NSW CIFOA (Coastal Integrated Forestry Operations Protocols). This defaults the plot size to a circular radius 2.26m. Recommend flight parameters are to use a DJI Zenmuse H20 camera at 80m AGL, and zoom level 281mm, with Yaw=0 and Pitch=90. Tree Height Est (m) parameter would normally be set at zero metres as it is focused on the small regenerating seedlings at the ground surface. In version 1 of this model, Ai detection is not implemented as training datasets are in a development phase. After processing, users will select regenerating seedlings using the Refine Tree Detection tool. Users can also define the plot as “overtopped”. Additional outputs are provided in addition to tree count / trees per hectare, which are “Over Topped” and “Stocked”, whereby Stocked is TRUE when the plot is either “Over Topped” or has a tree count. There are displayed on the imagery overlays, and also respective output files both at a summary level and individual plot level. As with all virtual plots, users can also define plots as VertifiedUnstocked and InvasiveWeedsPresent which can he helpful to meet the requirements under the CIFOA protocol. Ref: Coastal Integrated Forestry Operations Approval – Protocols |
Examples of Models Being Applied
Some examples of drone imagery, forest types, Ai Model selection and typical flight specifications to achieve results.
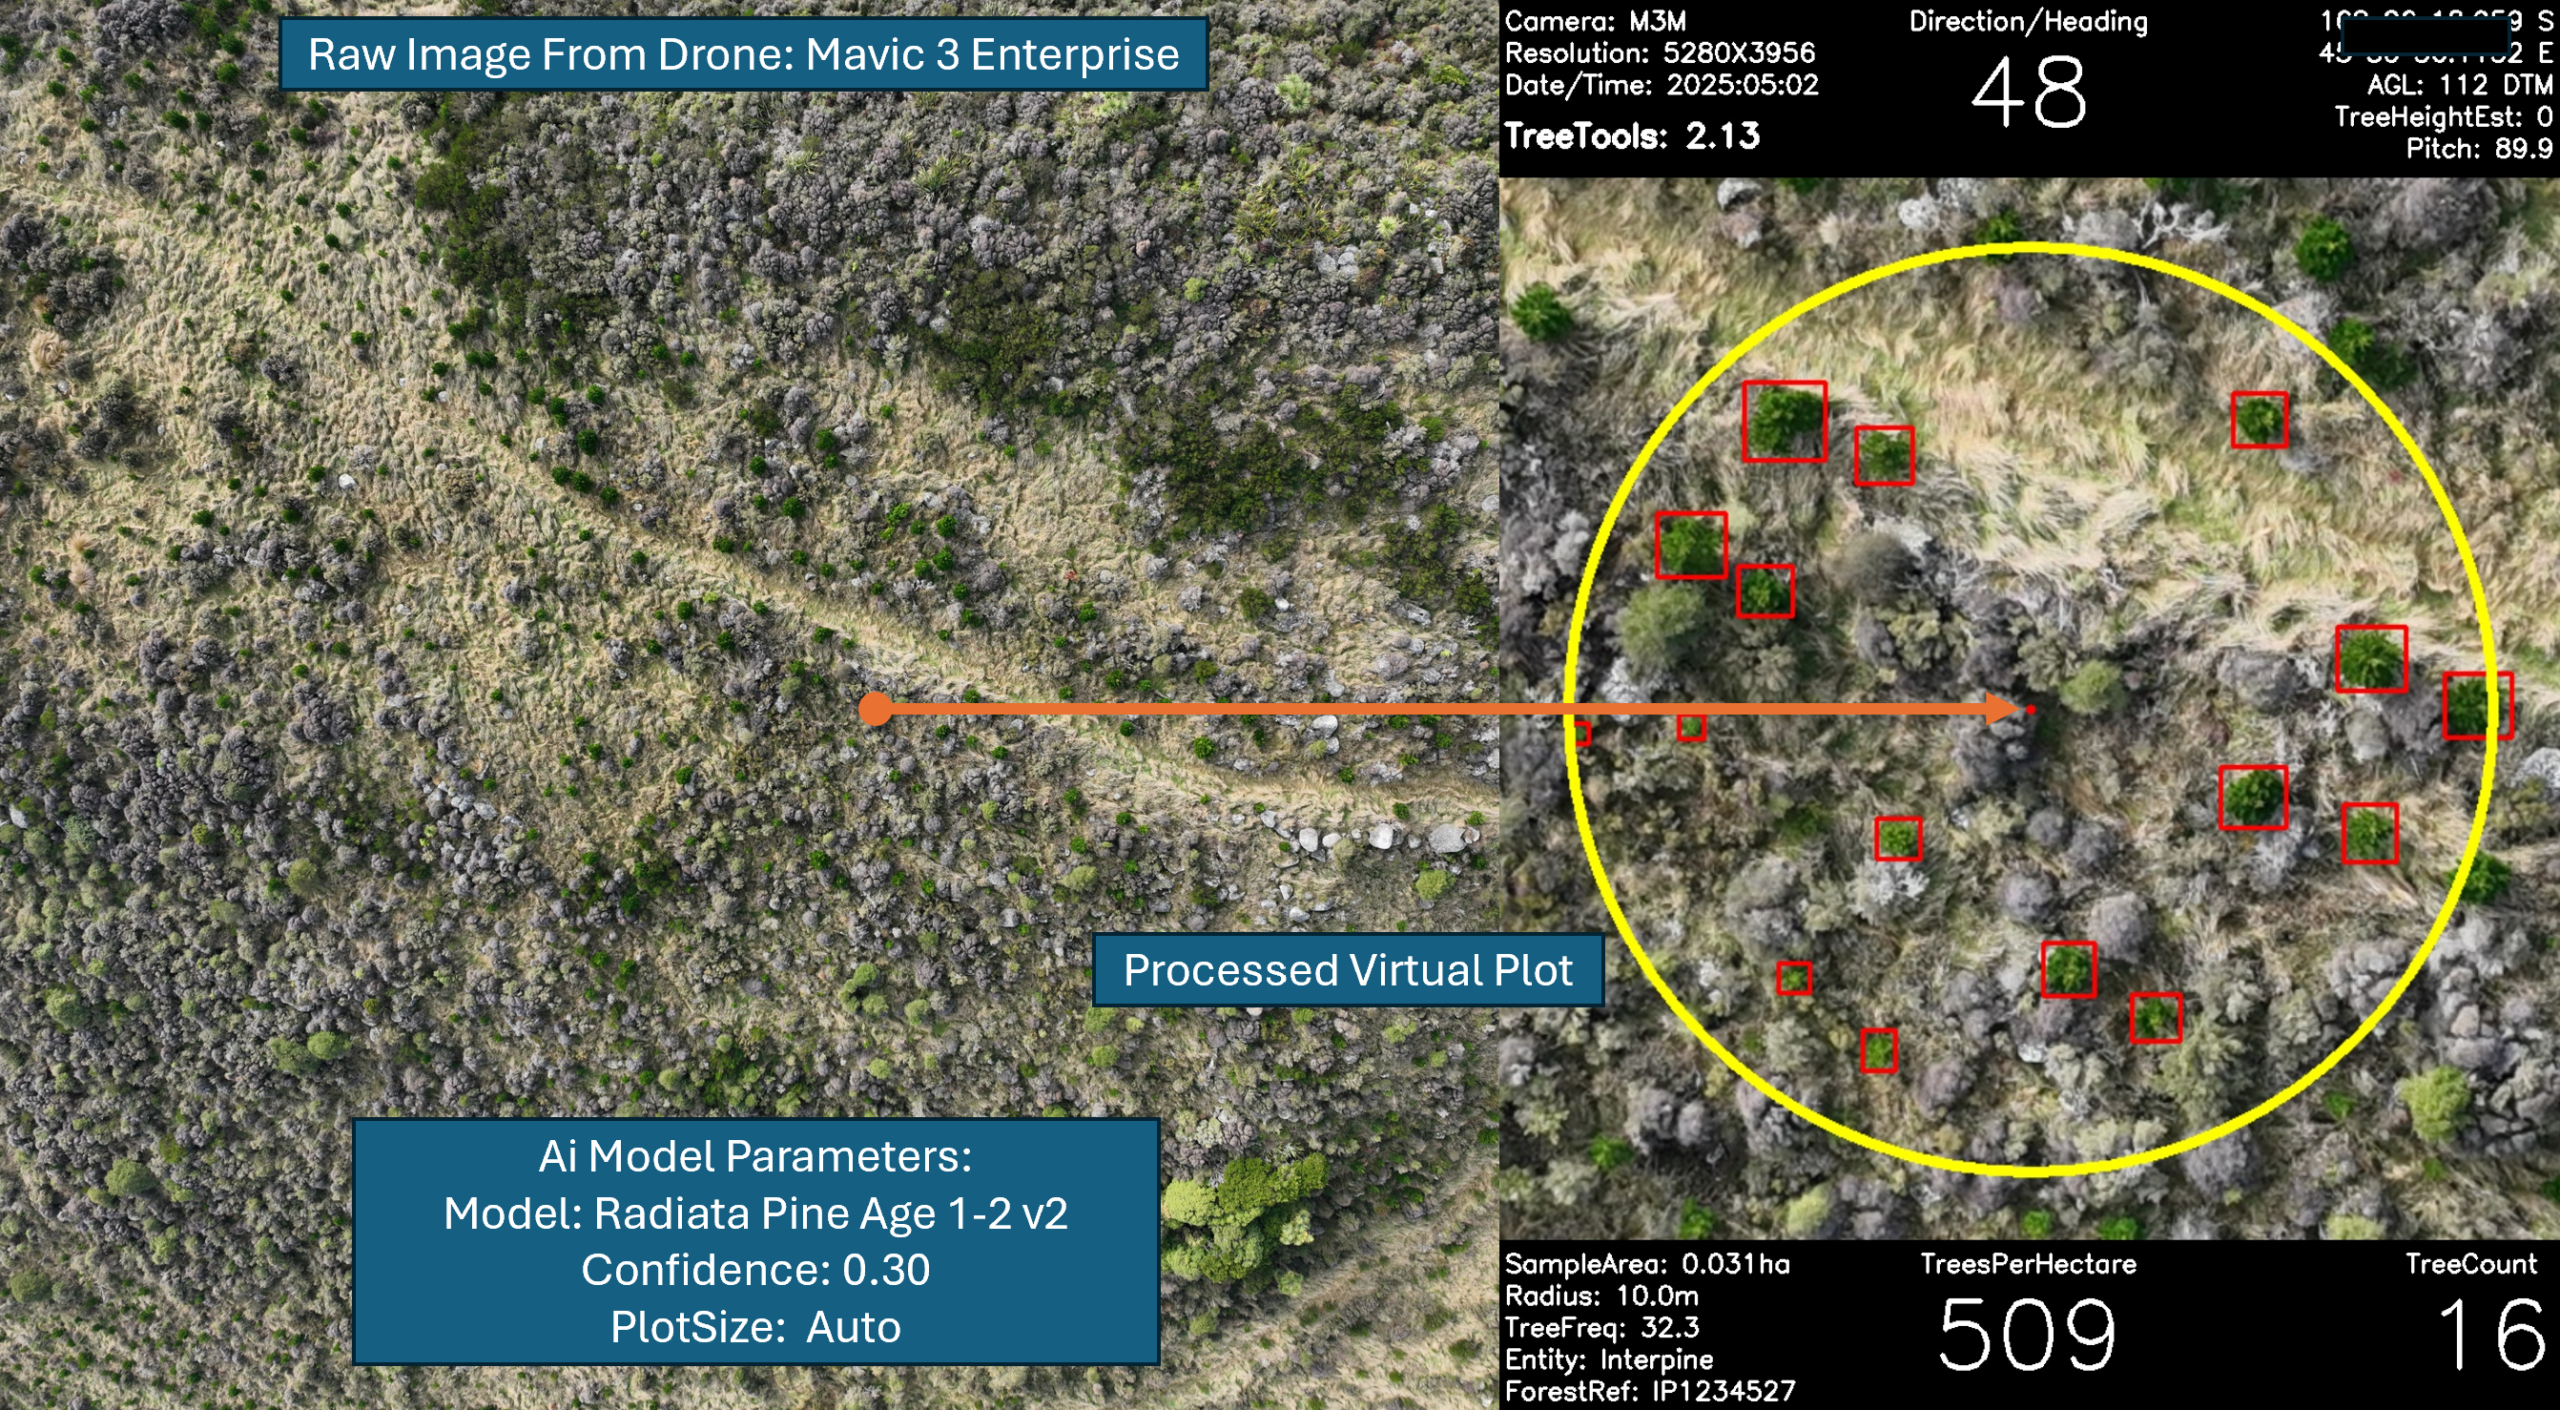
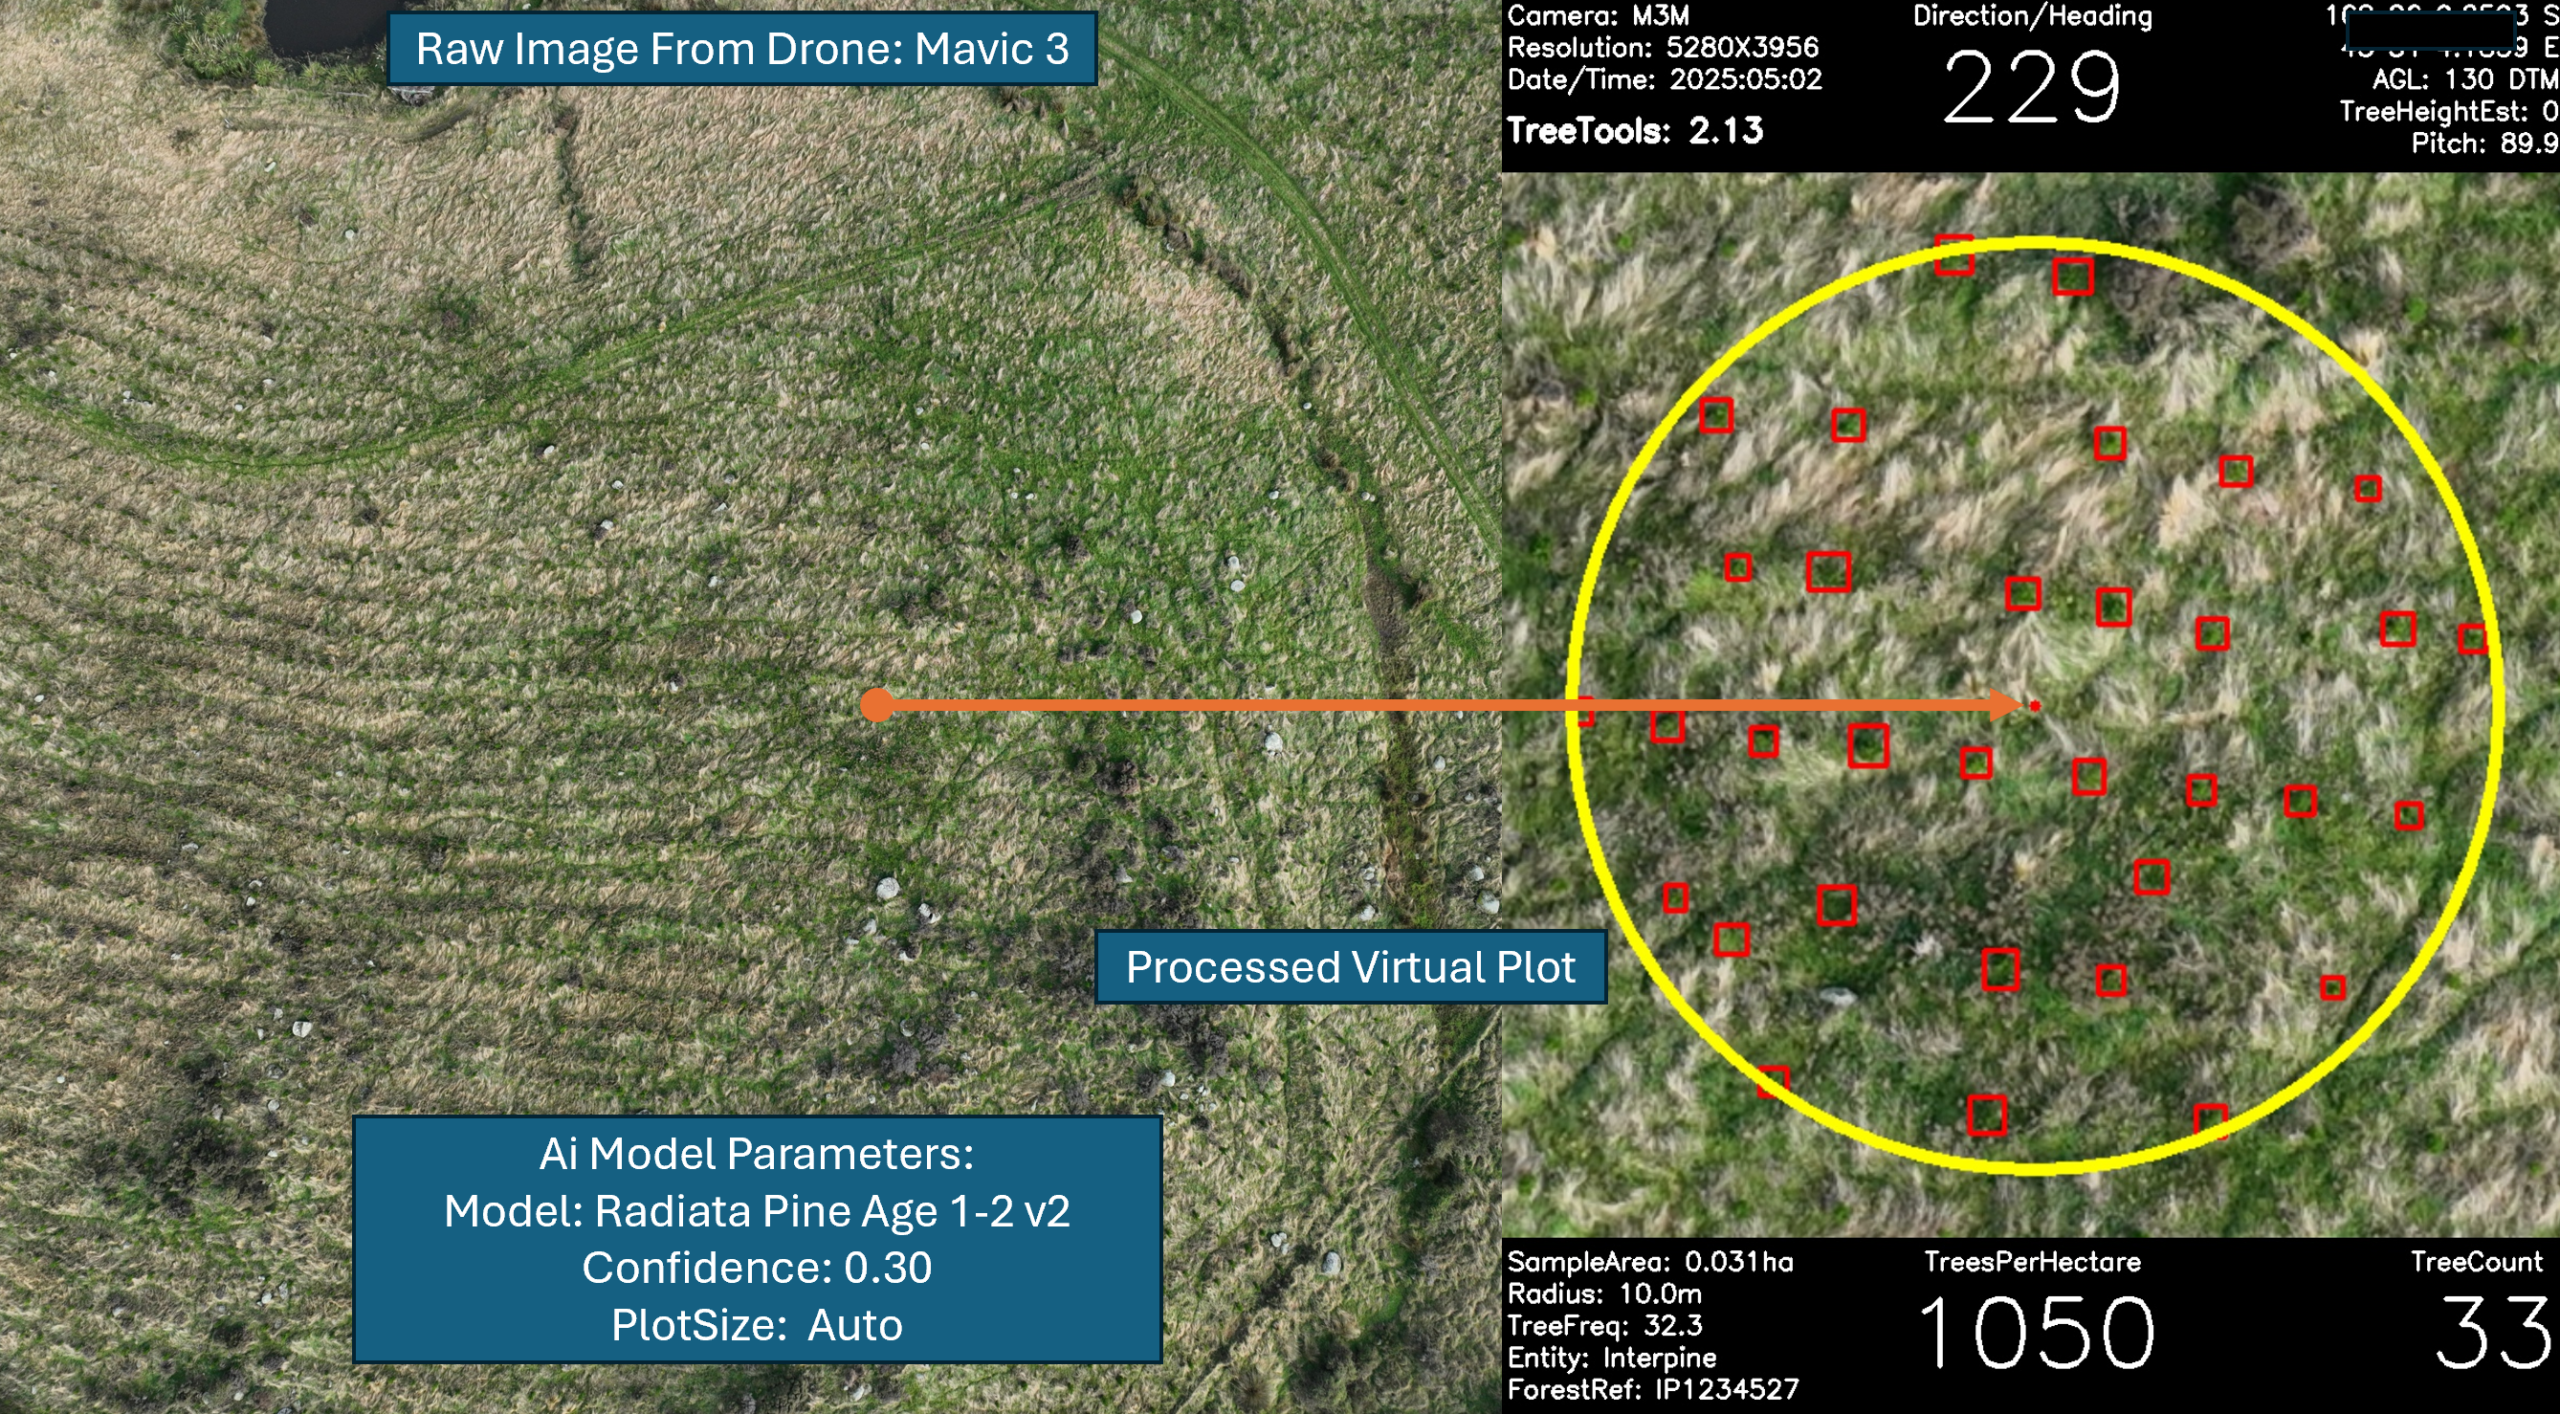
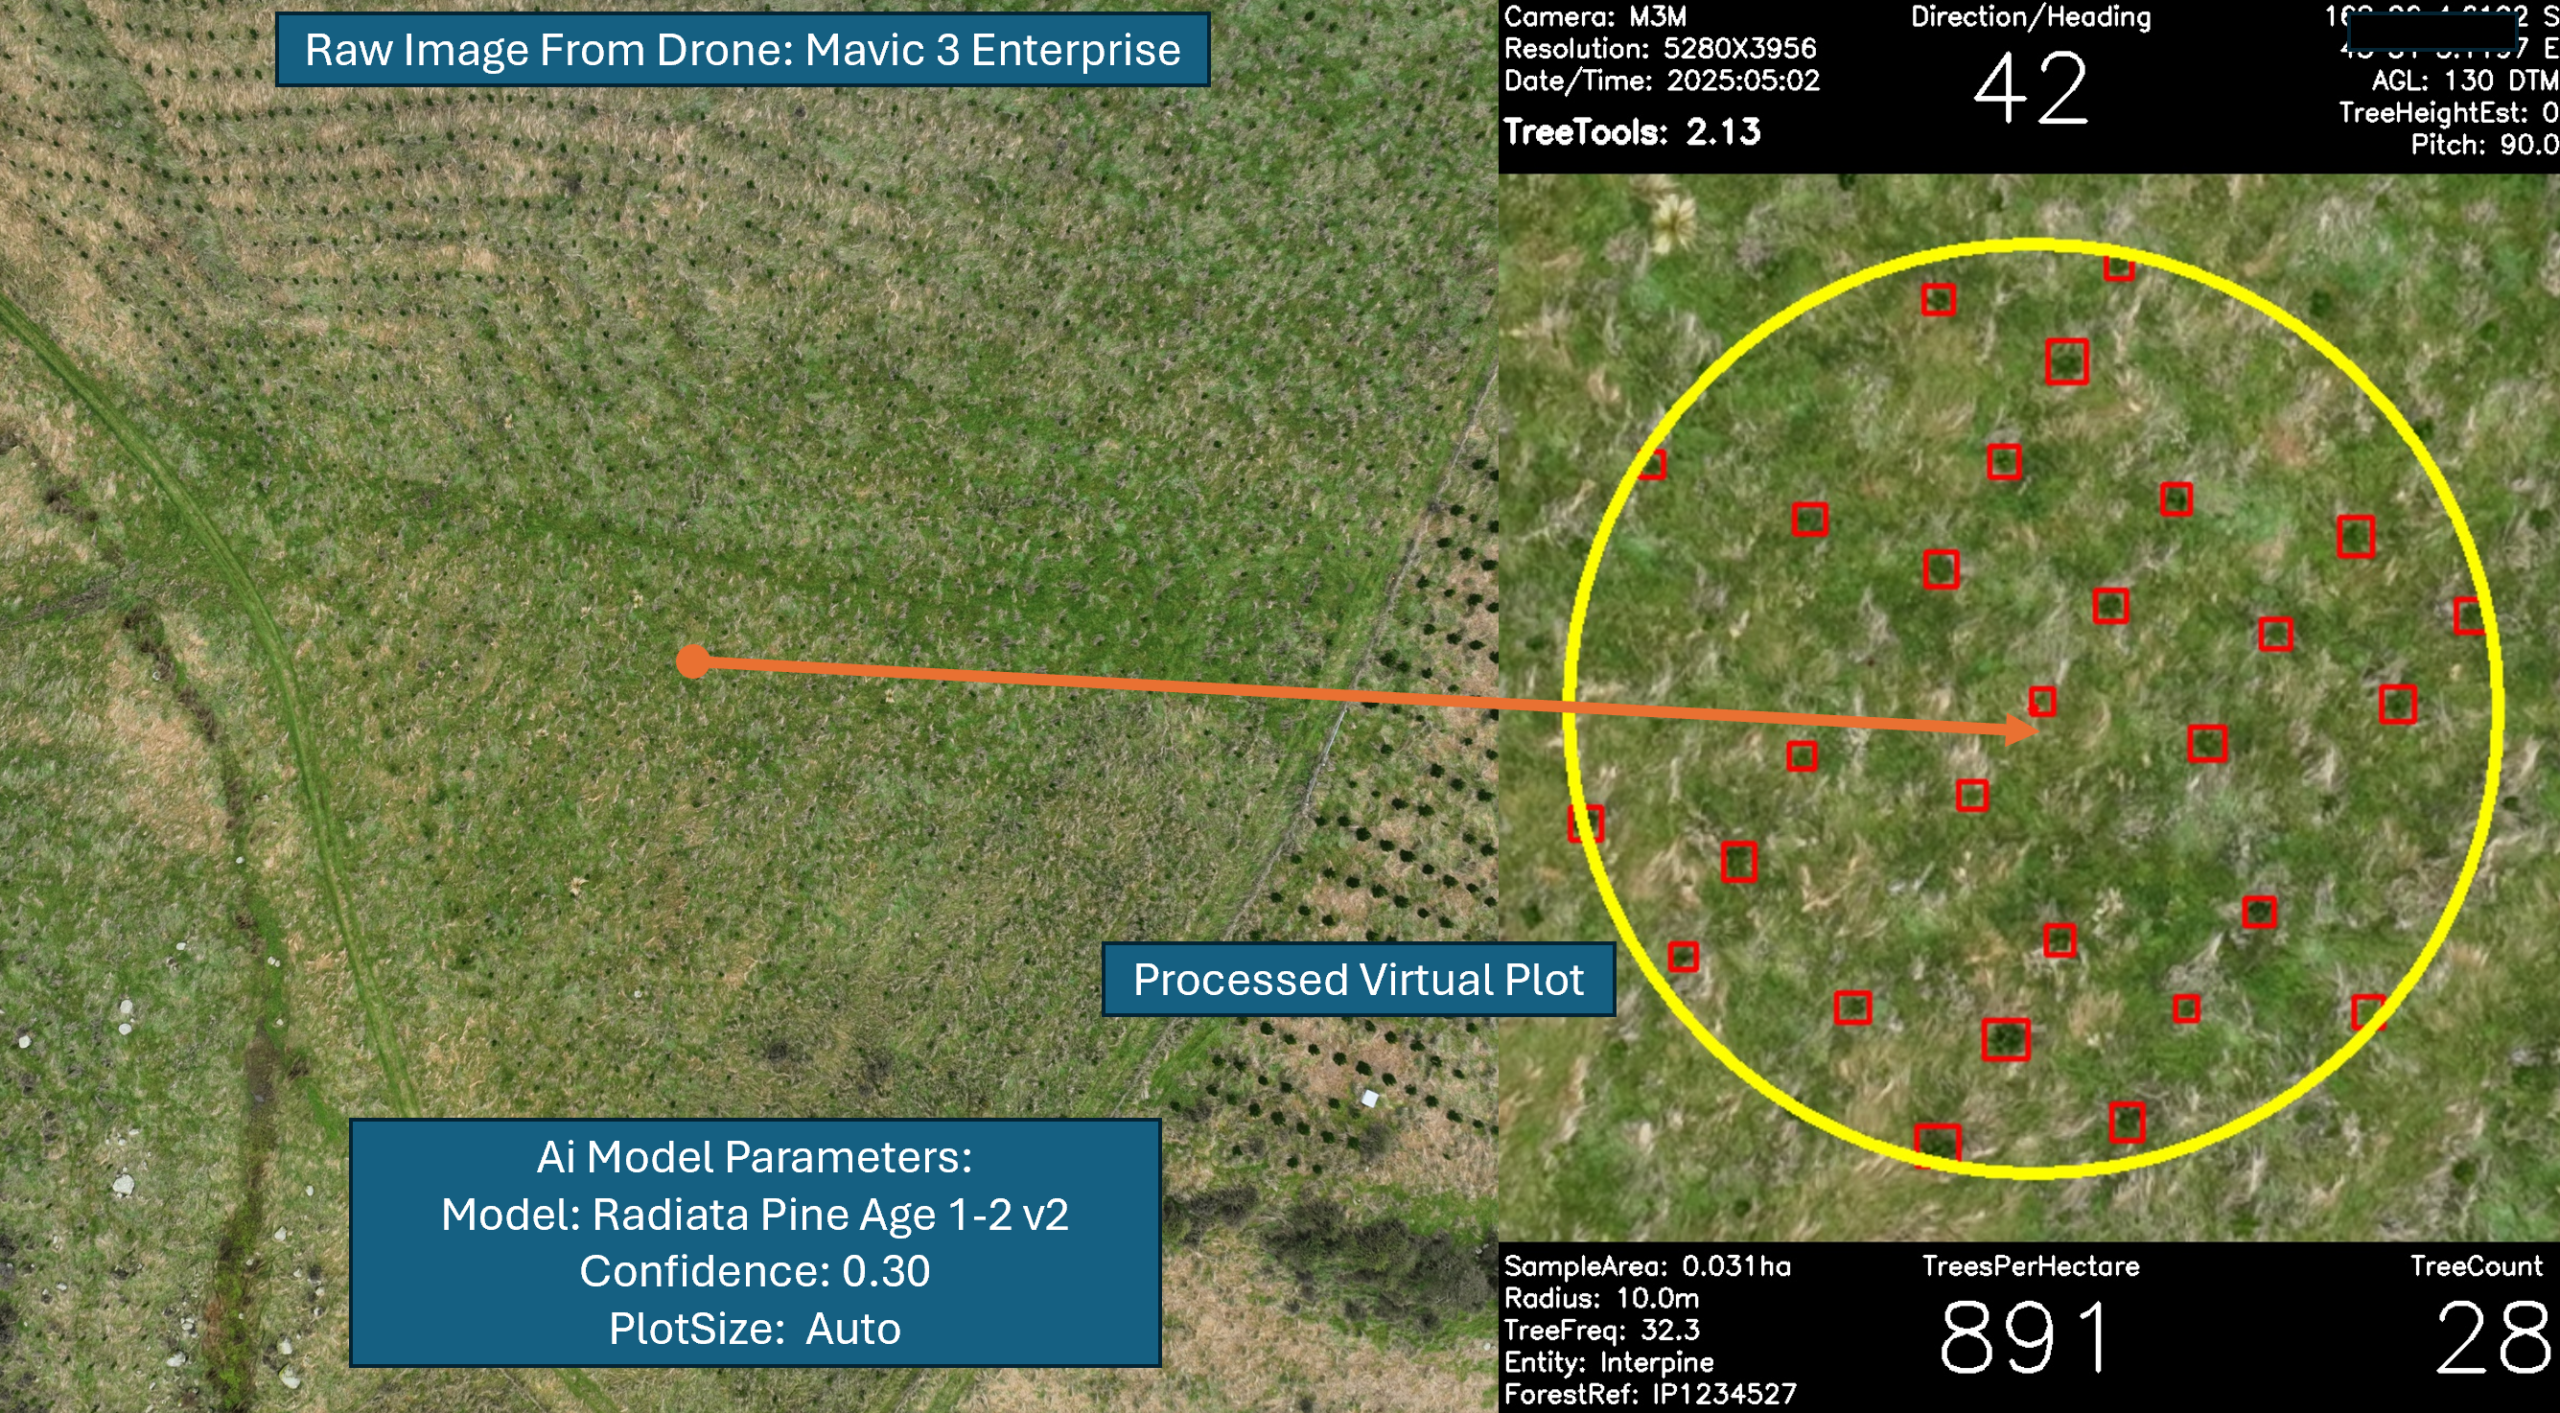
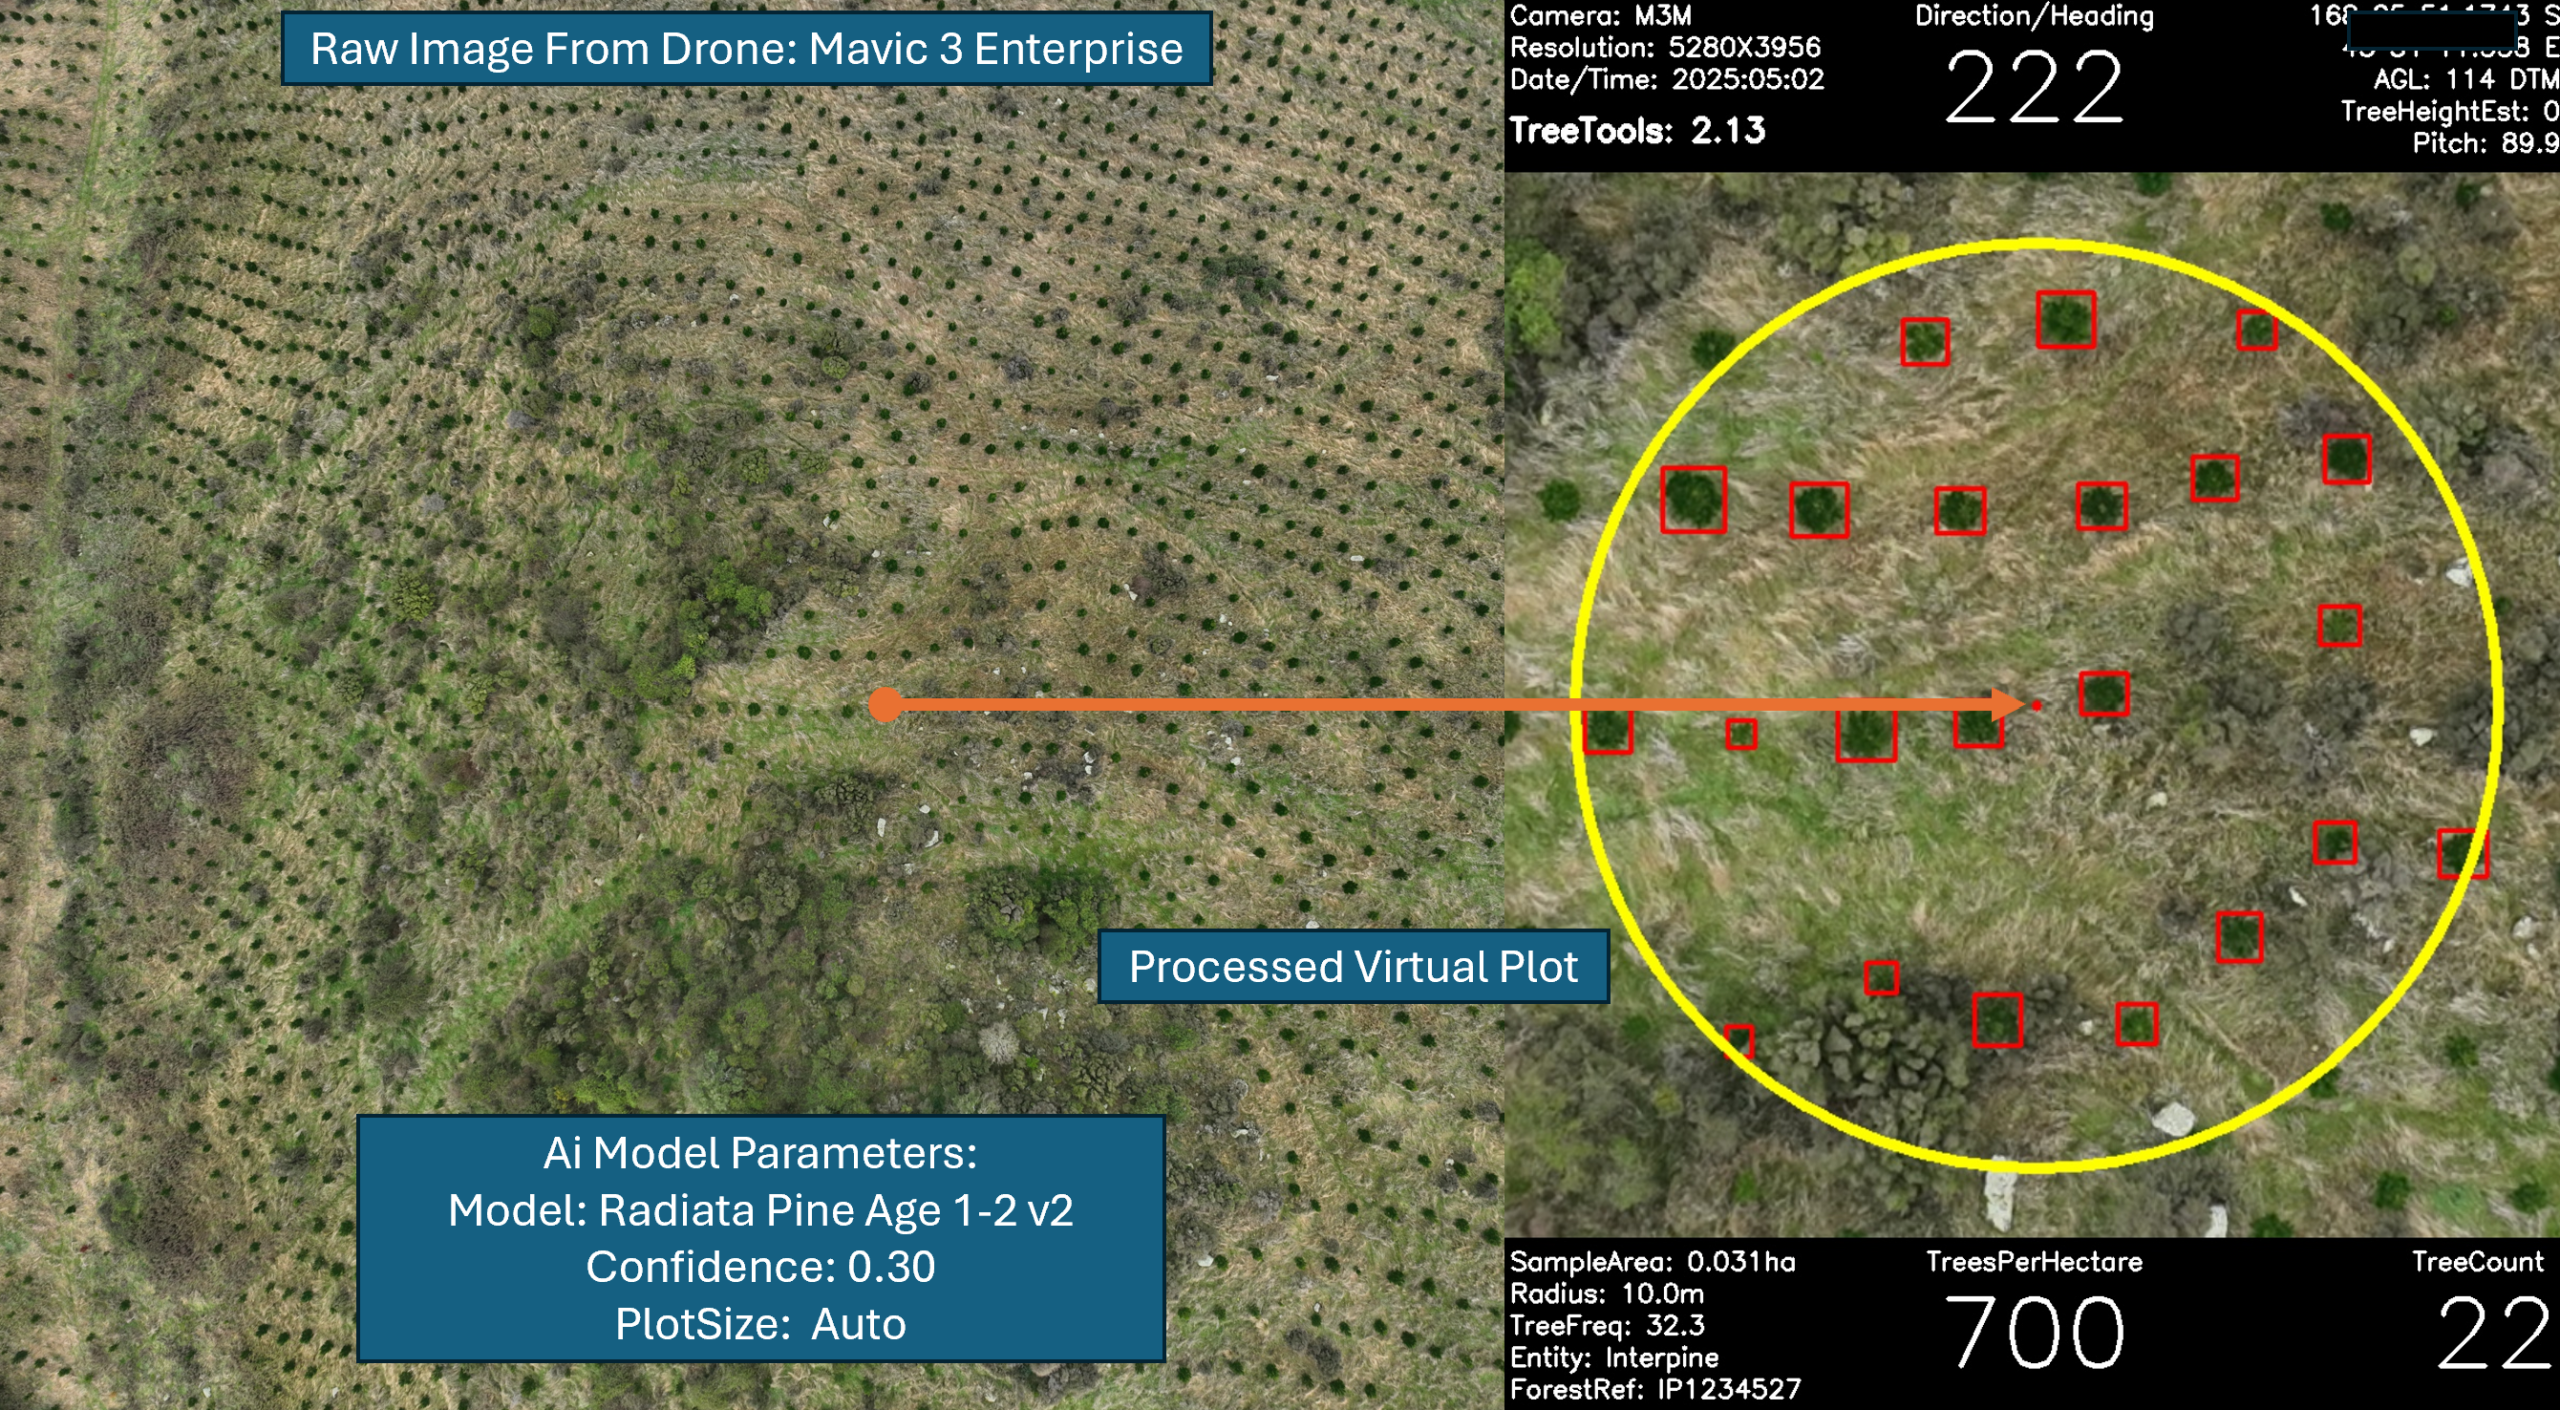
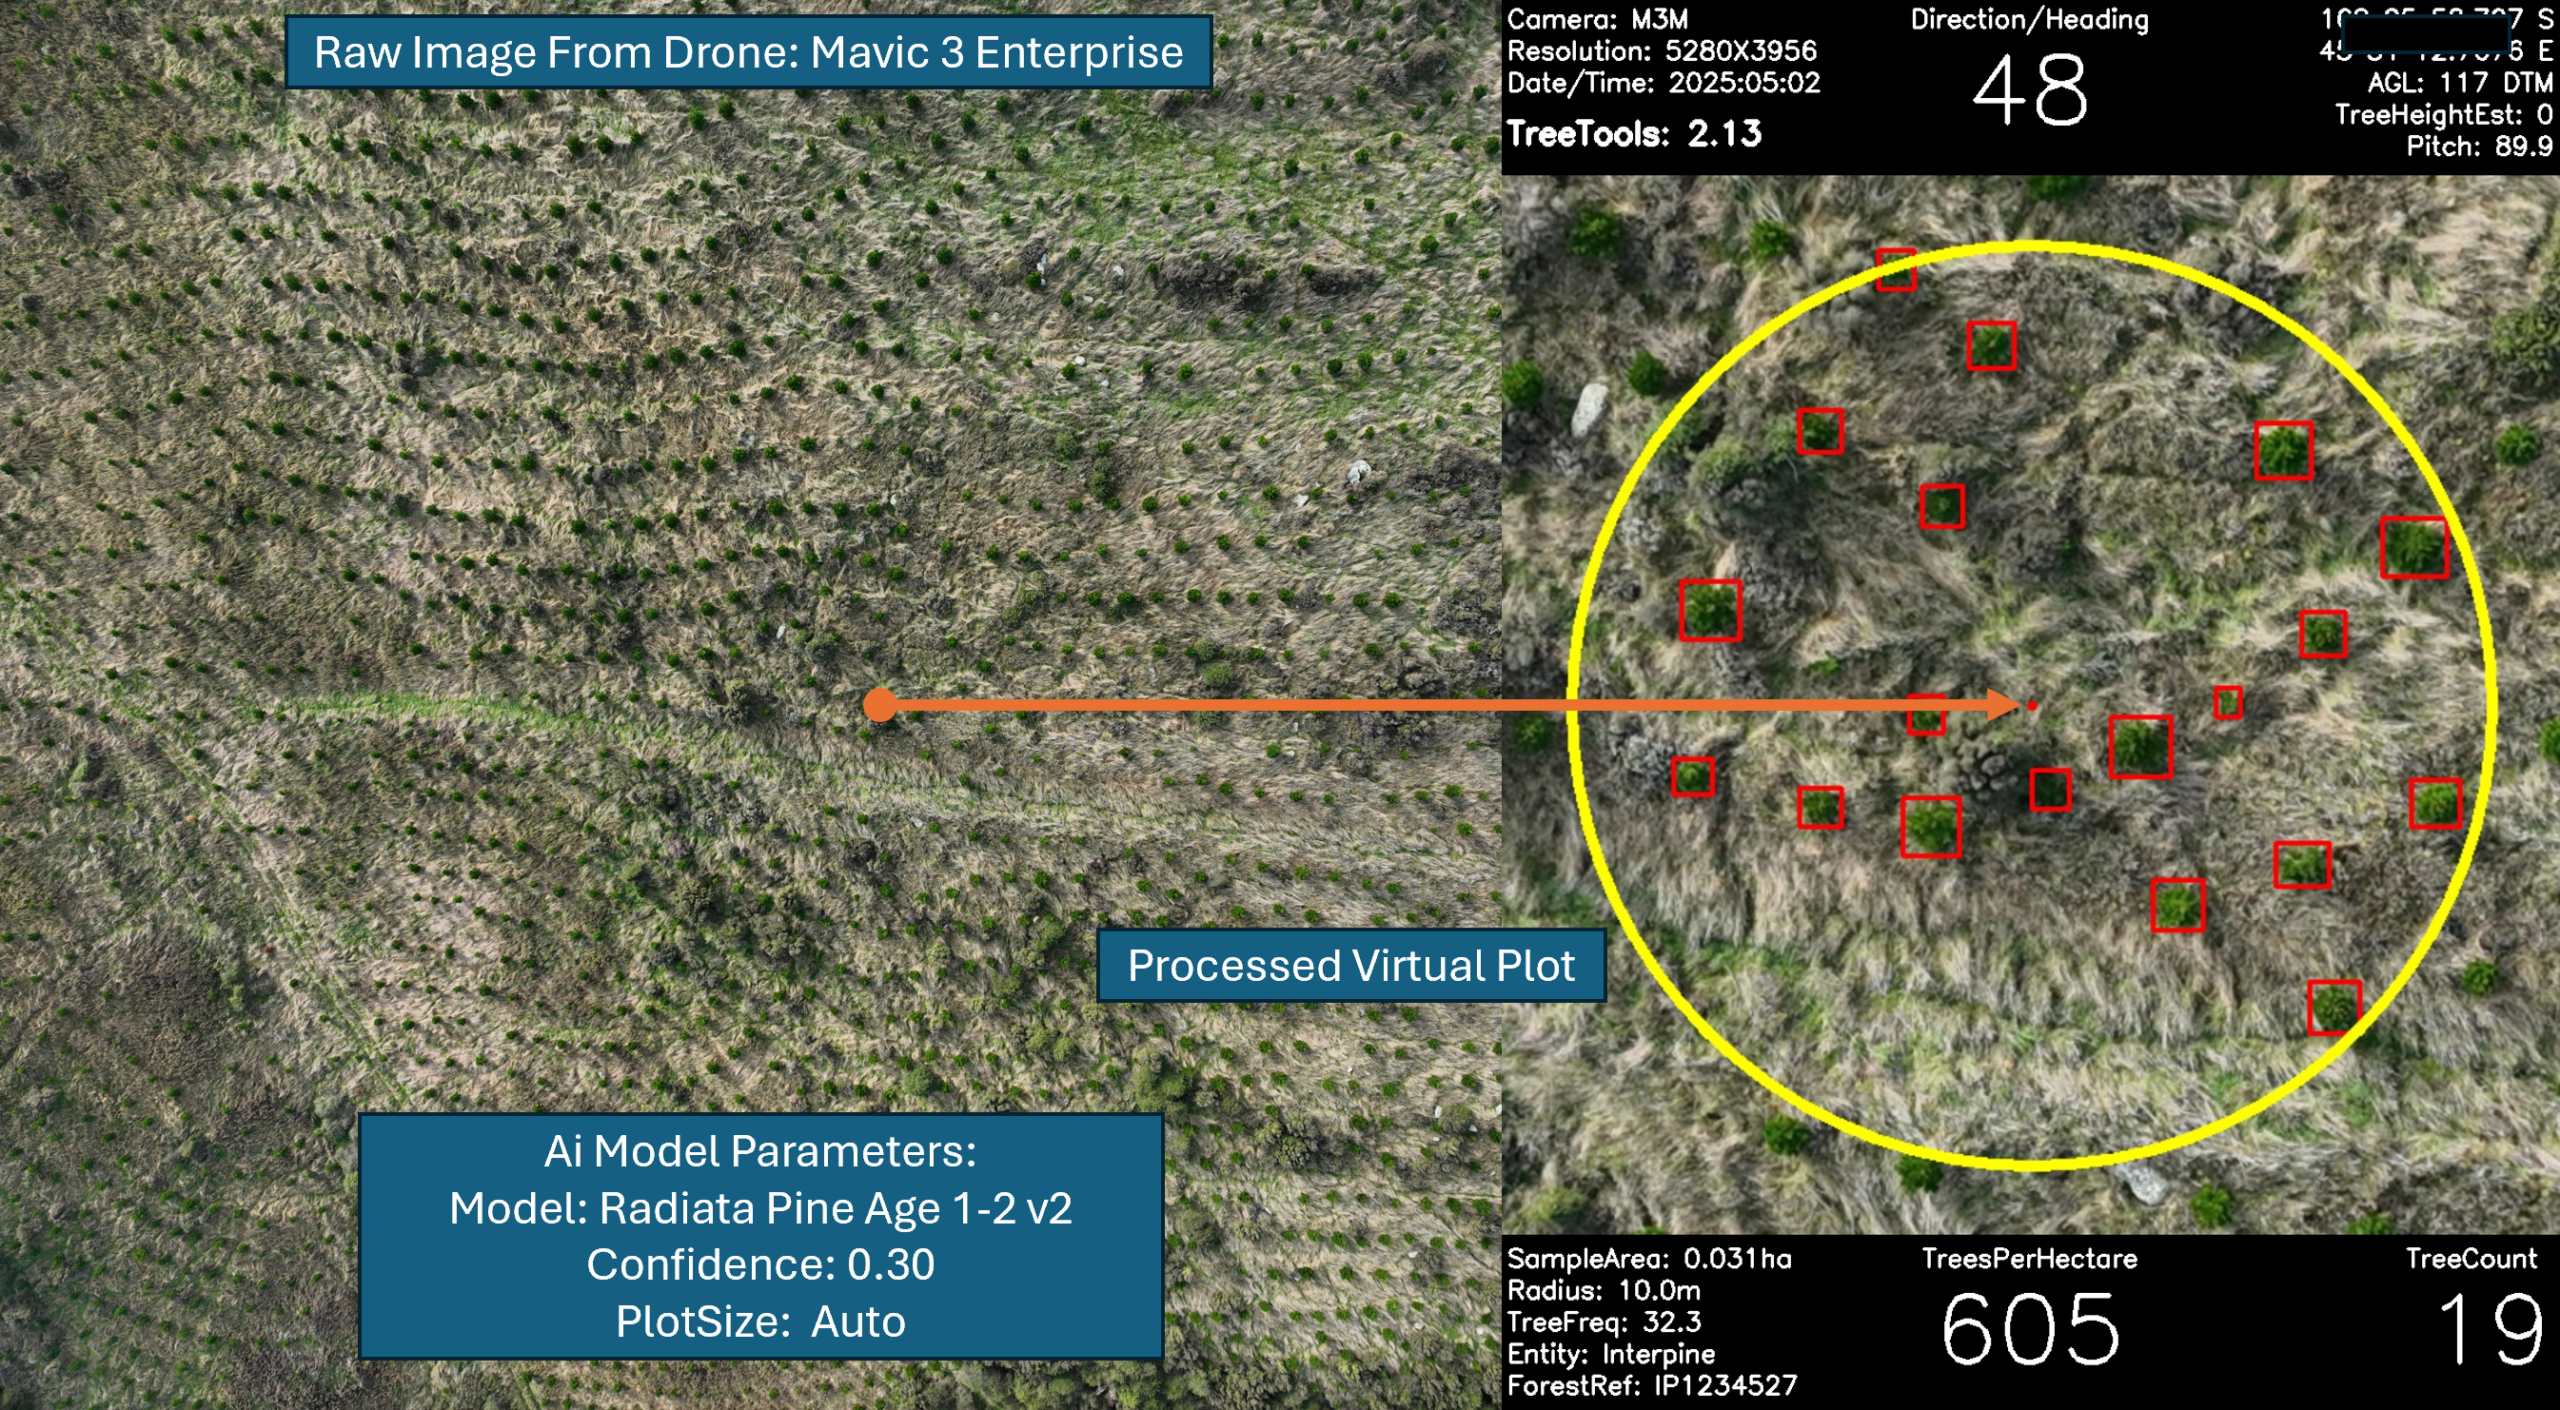
Radiata Pine Age 1 to 2 Early Age Assessment Using Virtual Plot:
Drone used was a DJI Mavic 3 Enterprise Multispectral (in this case only using RGB image for processing). Flight is planned in DJI Pilot 2 as a mapping flight, with 20% forward and side overlap just for the purposes of getting a reasonable number of images for plot assessment but also covering the area quickly. Flight altitude was locked at 120m AGL using the inbuilt DJI Terrain Follow. This is a first rotation establishment site, with a range of differing vegetation conditions. Approx tree height parameter set at 1m as most of the trees were 0.5-1m tall. Ai Model = Age 1-2 Assessment (version 2) with 30% confidence value and auto plot size. During processing to increase precision of results a Digital Terrain Model (DTM) was used, which was freely available from LINZ National Elevation Program.
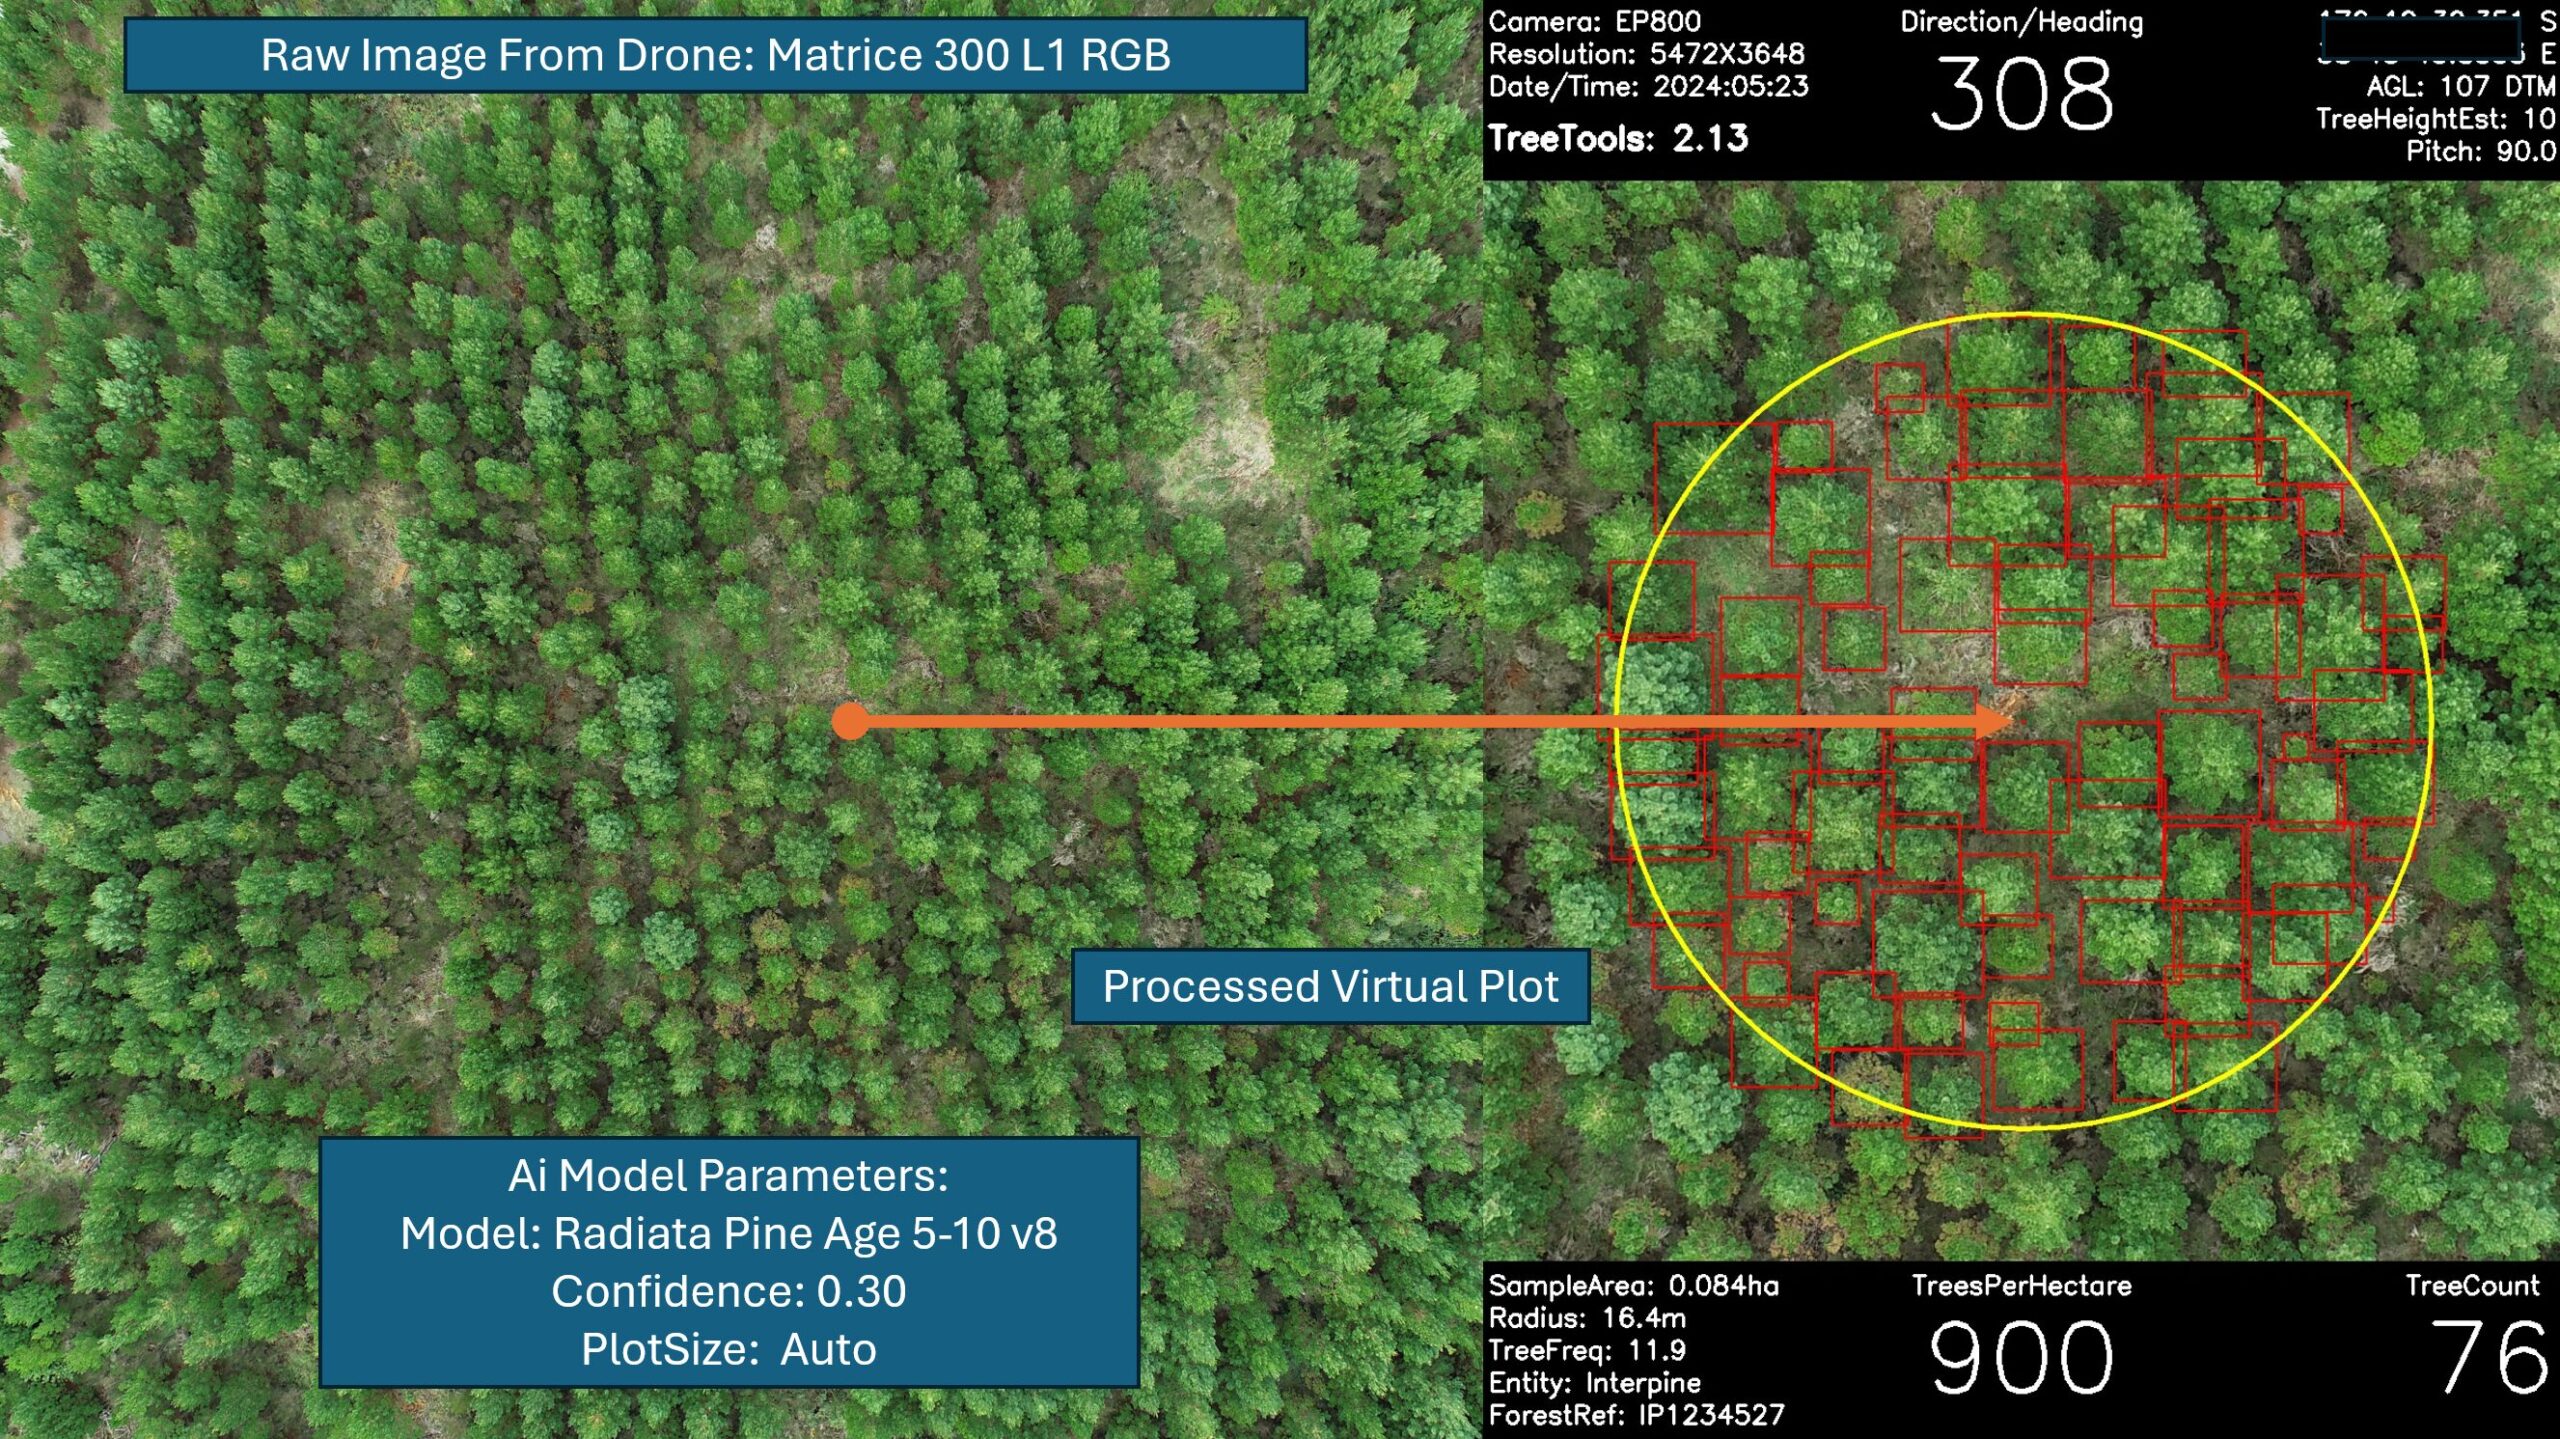
Radiata Pine Age 5 Pre Assessment Using Virtual Plot:
Drone used was a DJI Matrice 300 using the DJI L1 RGB sensor imagery output (in this case only using RGB image for processing). Flight is planned in DJI Pilot 2 as a mapping flight, with 20% forward and side overlap just for the purposes of getting a reasonable number of images for plot assessment but also covering the area quickly. Flight altitude was locked at 100m AGL using the inbuilt DJI Terrain Follow. This is a second rotation establishment site, with a range of differing vegetation conditions. Ai Model = Radiata Age 5-10 Assessment (version 8) with 30% confidence value and auto plot size. During processing to increase precision of results a Digital Terrain Model (DTM) was used, which was freely available from LINZ National Elevation Program.
Images Processing Workflow
This will take a folder/s of images and analyze them, creating a virtual plot for each of the JPEG files located in the folder.
TIP: Clean up the folder prior to analysis, removing any images which are not relevant to your area of interest.
Once you have downloaded the images using an SD card from your drone, click the images process button and upload the target folder. Additional parameters will then become available on the VirtuaPlot interface.
| Parameter | Description / Use |
|---|---|
| Image Folder | Select the folder of images to be processed. All subfolders of images in the folder will also be processed if present. OPEN will automatically open the target image folder. |
| Boundary (Optional) | Select an area of interest (AOI) boundary shape file. This would typically be a forest stand boundary. This will filter the results for only those plots that fall within the boundary provided. Required format *.SHP (ESRI Shape file). |
| DTM (Optional) | Select a DTM to refine the AGL (m) and get higher precision results. Currently supporting both NZVD2016 and Ellipsoidal vertical datums, and the horizontal coordinates could be NZTM2000 or WGS84. This is recommended to improve the precision of the results in steeper forest areas. |
| Clear DTM | Clear or remove the use of DTM during processing. |
| Vertical Datum | Select the vertical datum of the DTM uploaded. Currently supporting both NZVD2016 and Ellipsoidal vertical datums. |
| Take-Off Image | This image is used to calibrate to the provided DTM file, enabling precise plot area measurement. This is recommended when using a drone which only supports recording of height above take off point in the EXIF metadata within each image. Virtual Plot will prompt for this when this type of drone data is provided, and you have provided a DTM during analysis. Expecting an image file taken while drone is on the ground. Important Note: Images from different drone flights must not be saved in the same folder. A dedicated folder should be created for each individual flight. In this context, a single flight refers to a complete operation cycle: powering on the drone, takeoff, image acquisition, landing, and powering off. It is important to note that every time the drone is powered off and then restarted, its internal altitude reference is reset. As a result, using a takeoff image from a different flight will lead to errors in above-ground level (AGL) calculations. To ensure accuracy, always use the correct takeoff image corresponding to each specific flight. |
| Clear Take-Off Image | Clear or remove the use of a take-off image during processing. |
| GO | Start processing |
| PAUSE / CONTINUE | To pause and continue processing of selected folder of images. |
| STOP | Stop current processing. Will not complete the summary output files. |
| Refine | It activates a manual tree detection correcting interface. Users can manually add or delete tree detection boxes to correct tree detections and edit comment for each plot. |
| Open | Automatically open the target image folder where the results will be displayed. |
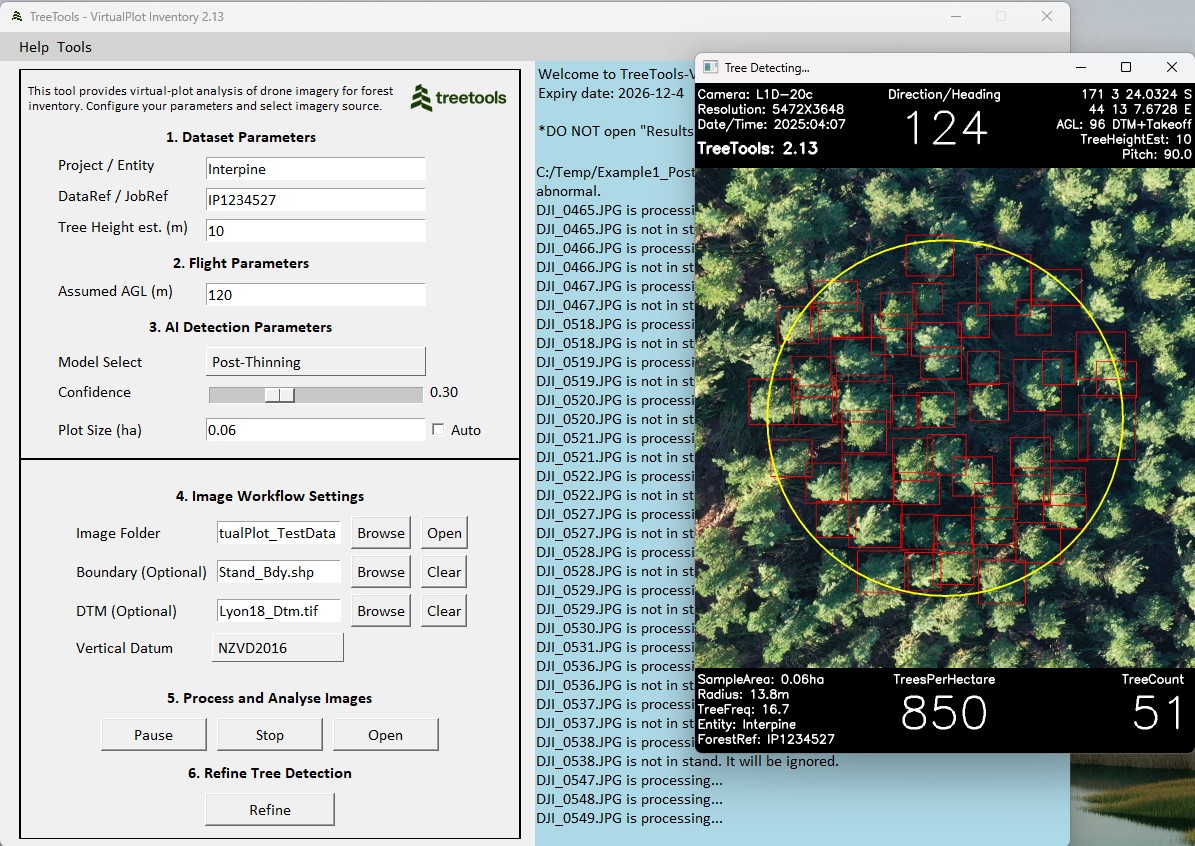
Image Processing to Virtual Forest Inventory Plots
Clicking the Go button will start processing. The images in the folder, including those in the subfolders, will be processed one by one and shown on the screen. The stocking is represented as “TreesPerHectare”, together with a TreeCount. You will see each image pop up with the detection and stocking estimates as it is processed.
You can stop the processing at any stage using the Stop button. Once you processing is complete, check out the results
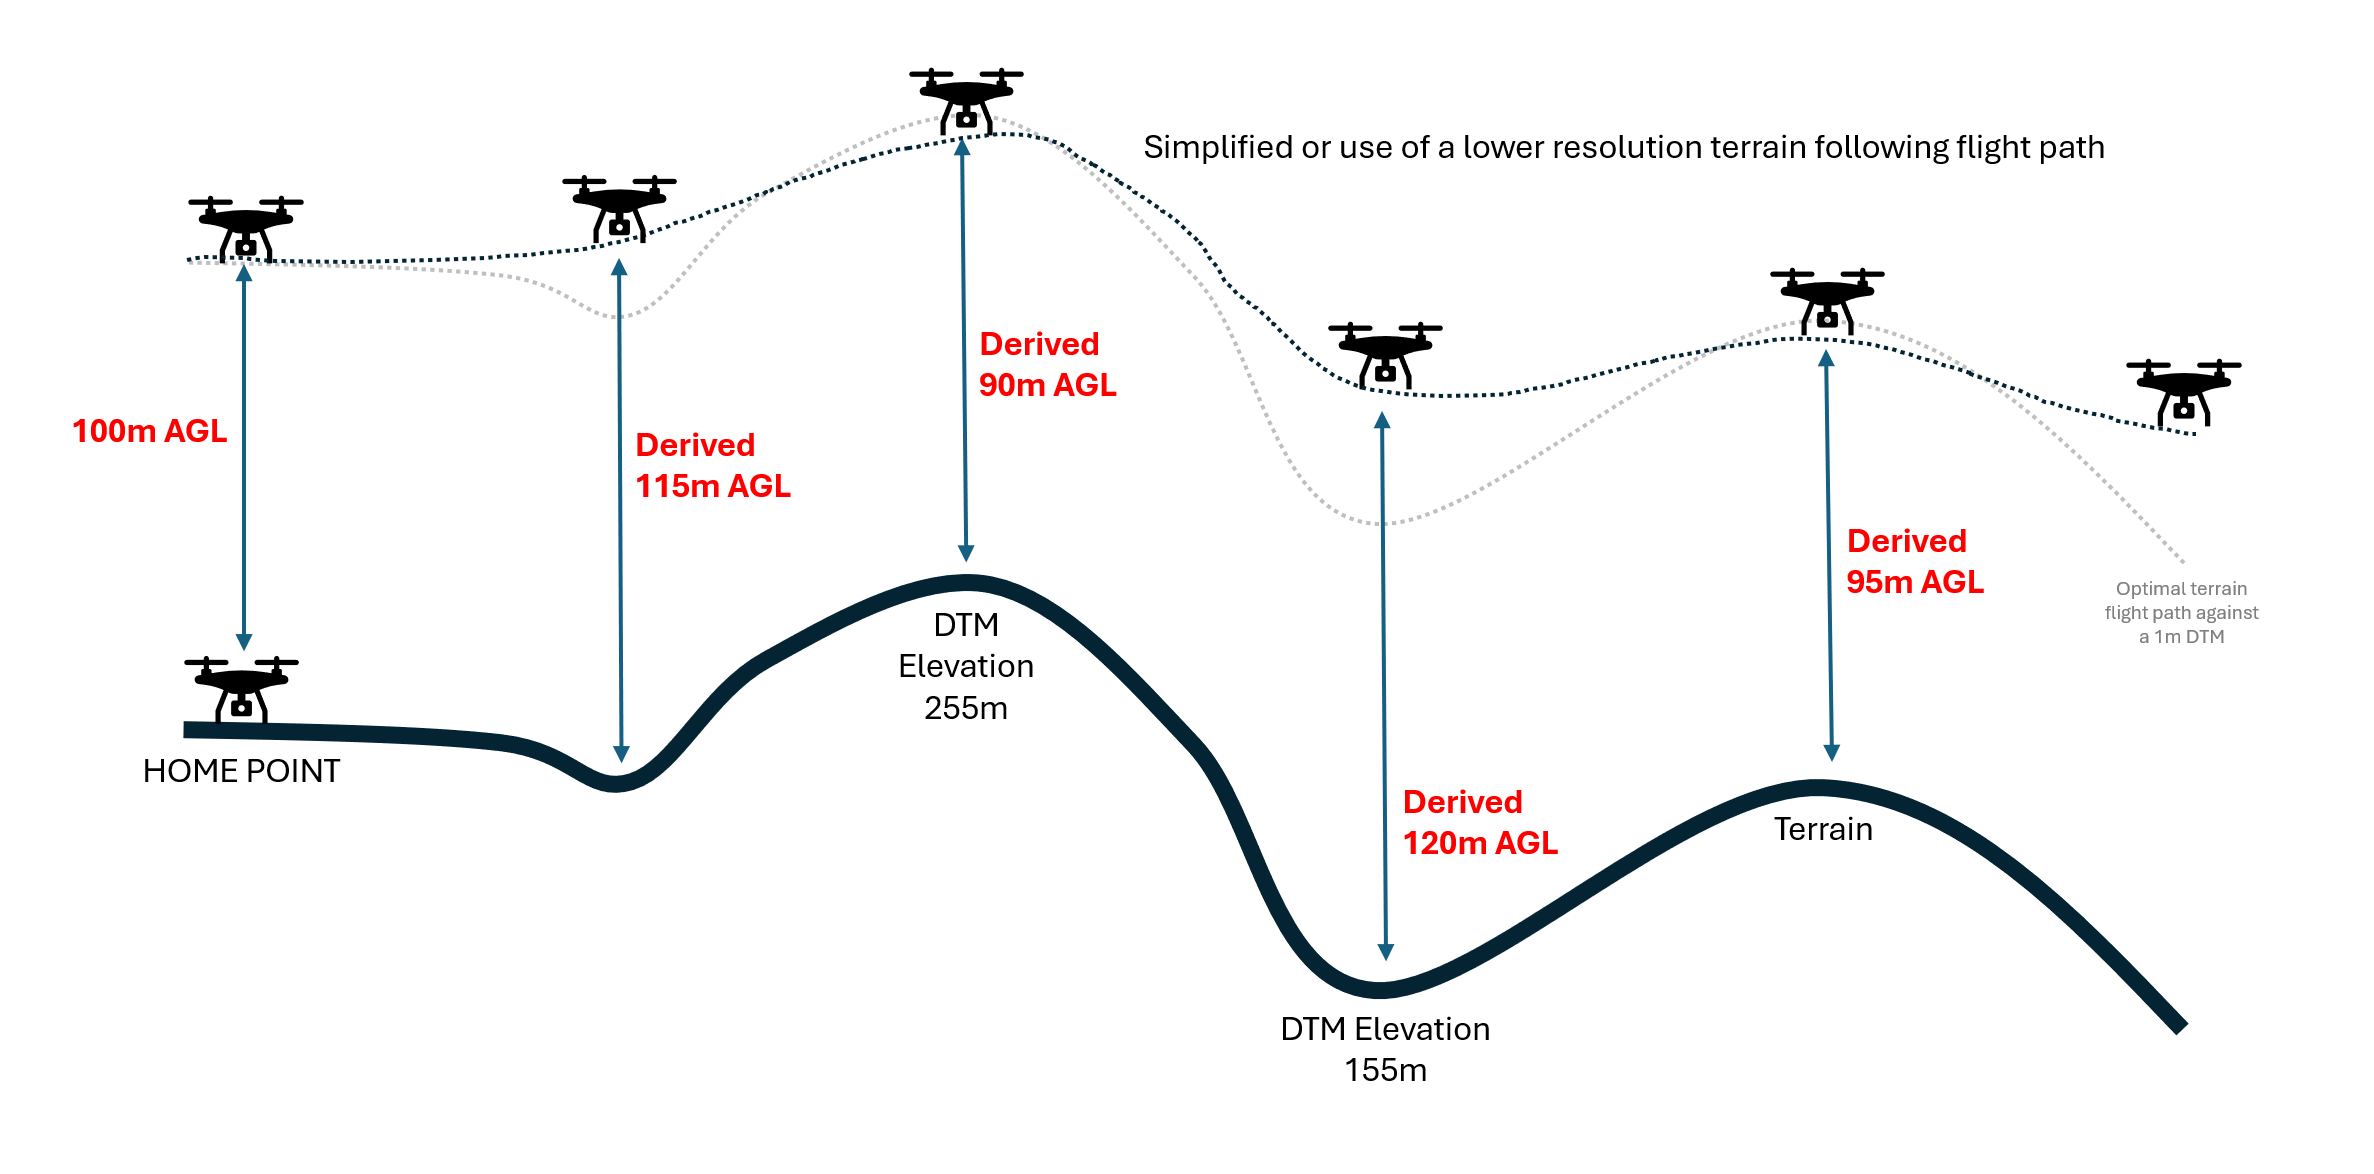
Improve Plot Area Precision Using a DTM
Providing a DTM to your processing workflow will improve your results by more precisely measuring the plot area. Terrain follow flights are often smoothed out flightpaths due to either use of a lower resolution terrain model or to avoid sharp drops or inclines in the drone flight. Therefore, even with a planned flight at 100m AGL (above ground level) you are likely to see variation in actual height above ground depending on the terrain of +/-10m or so. So, a way to compensate for this and get more precision from TreeTools VirtualPlot is to provide a 1m DTM which will be used to refine the flight height of the drone above ground for each image. For analysis in Virtual Plot, you will need to specify if the supplied DTM is in NZVD2016 or Ellipsoidal elevation heights. If the supplied DEM is in NZVD2016 Virtual Plot will do the conversion to Ellipsoidal heights automatically. As GeoTIFF files by themselves have no embedded geographic projection information, you will need to select this correctly to ensure you get the accurate results. Contact our team to support additional datums as needed.
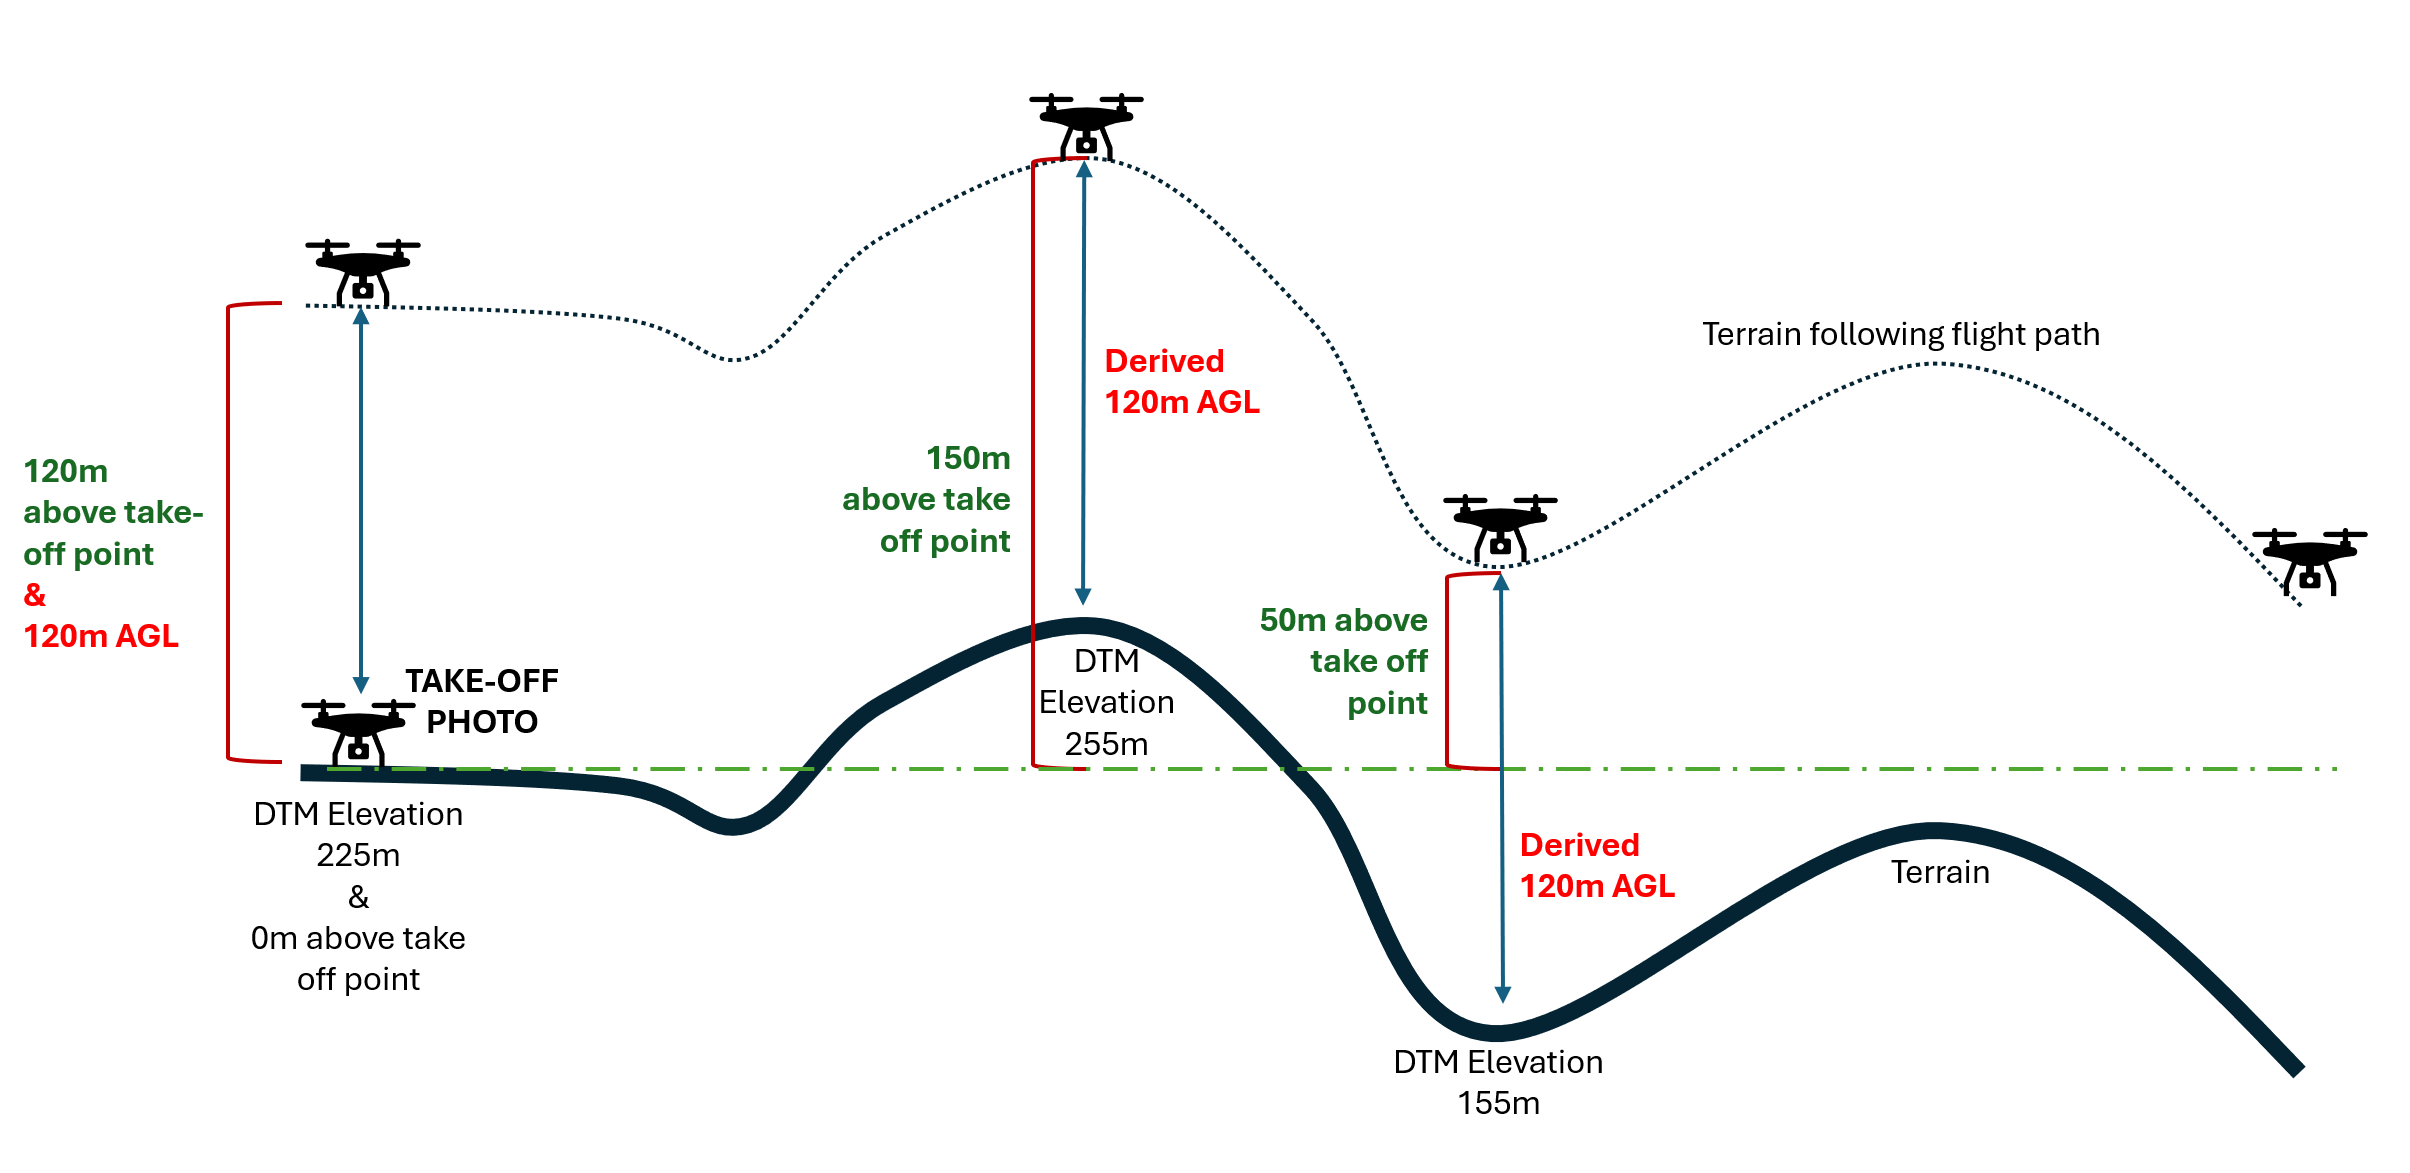
Use of Take-Off Image for DTM AGL Correction
For drone types that do not support recording of height above ellipsoid and only height above take off point (DJI Phantom 4, DJI Phantom 4 Pro, or DJI Mavic 2), virtual Plot will prompt you to upload a take-off location photo. This should have been taken at the home point while the drone is on the ground. This allows for precise plot area calculations based on the provided DTM.

Refine Tree Detection module
If the initial processing results are not satisfactory, you can use the “Refine Tree Detection” module. This enables you manually correct tree detection, classification and add comments.
Clicking “Refine” will activate a manual correction interface. Users can add comments and manually add or delete tree detection boxes to correct tree detections.
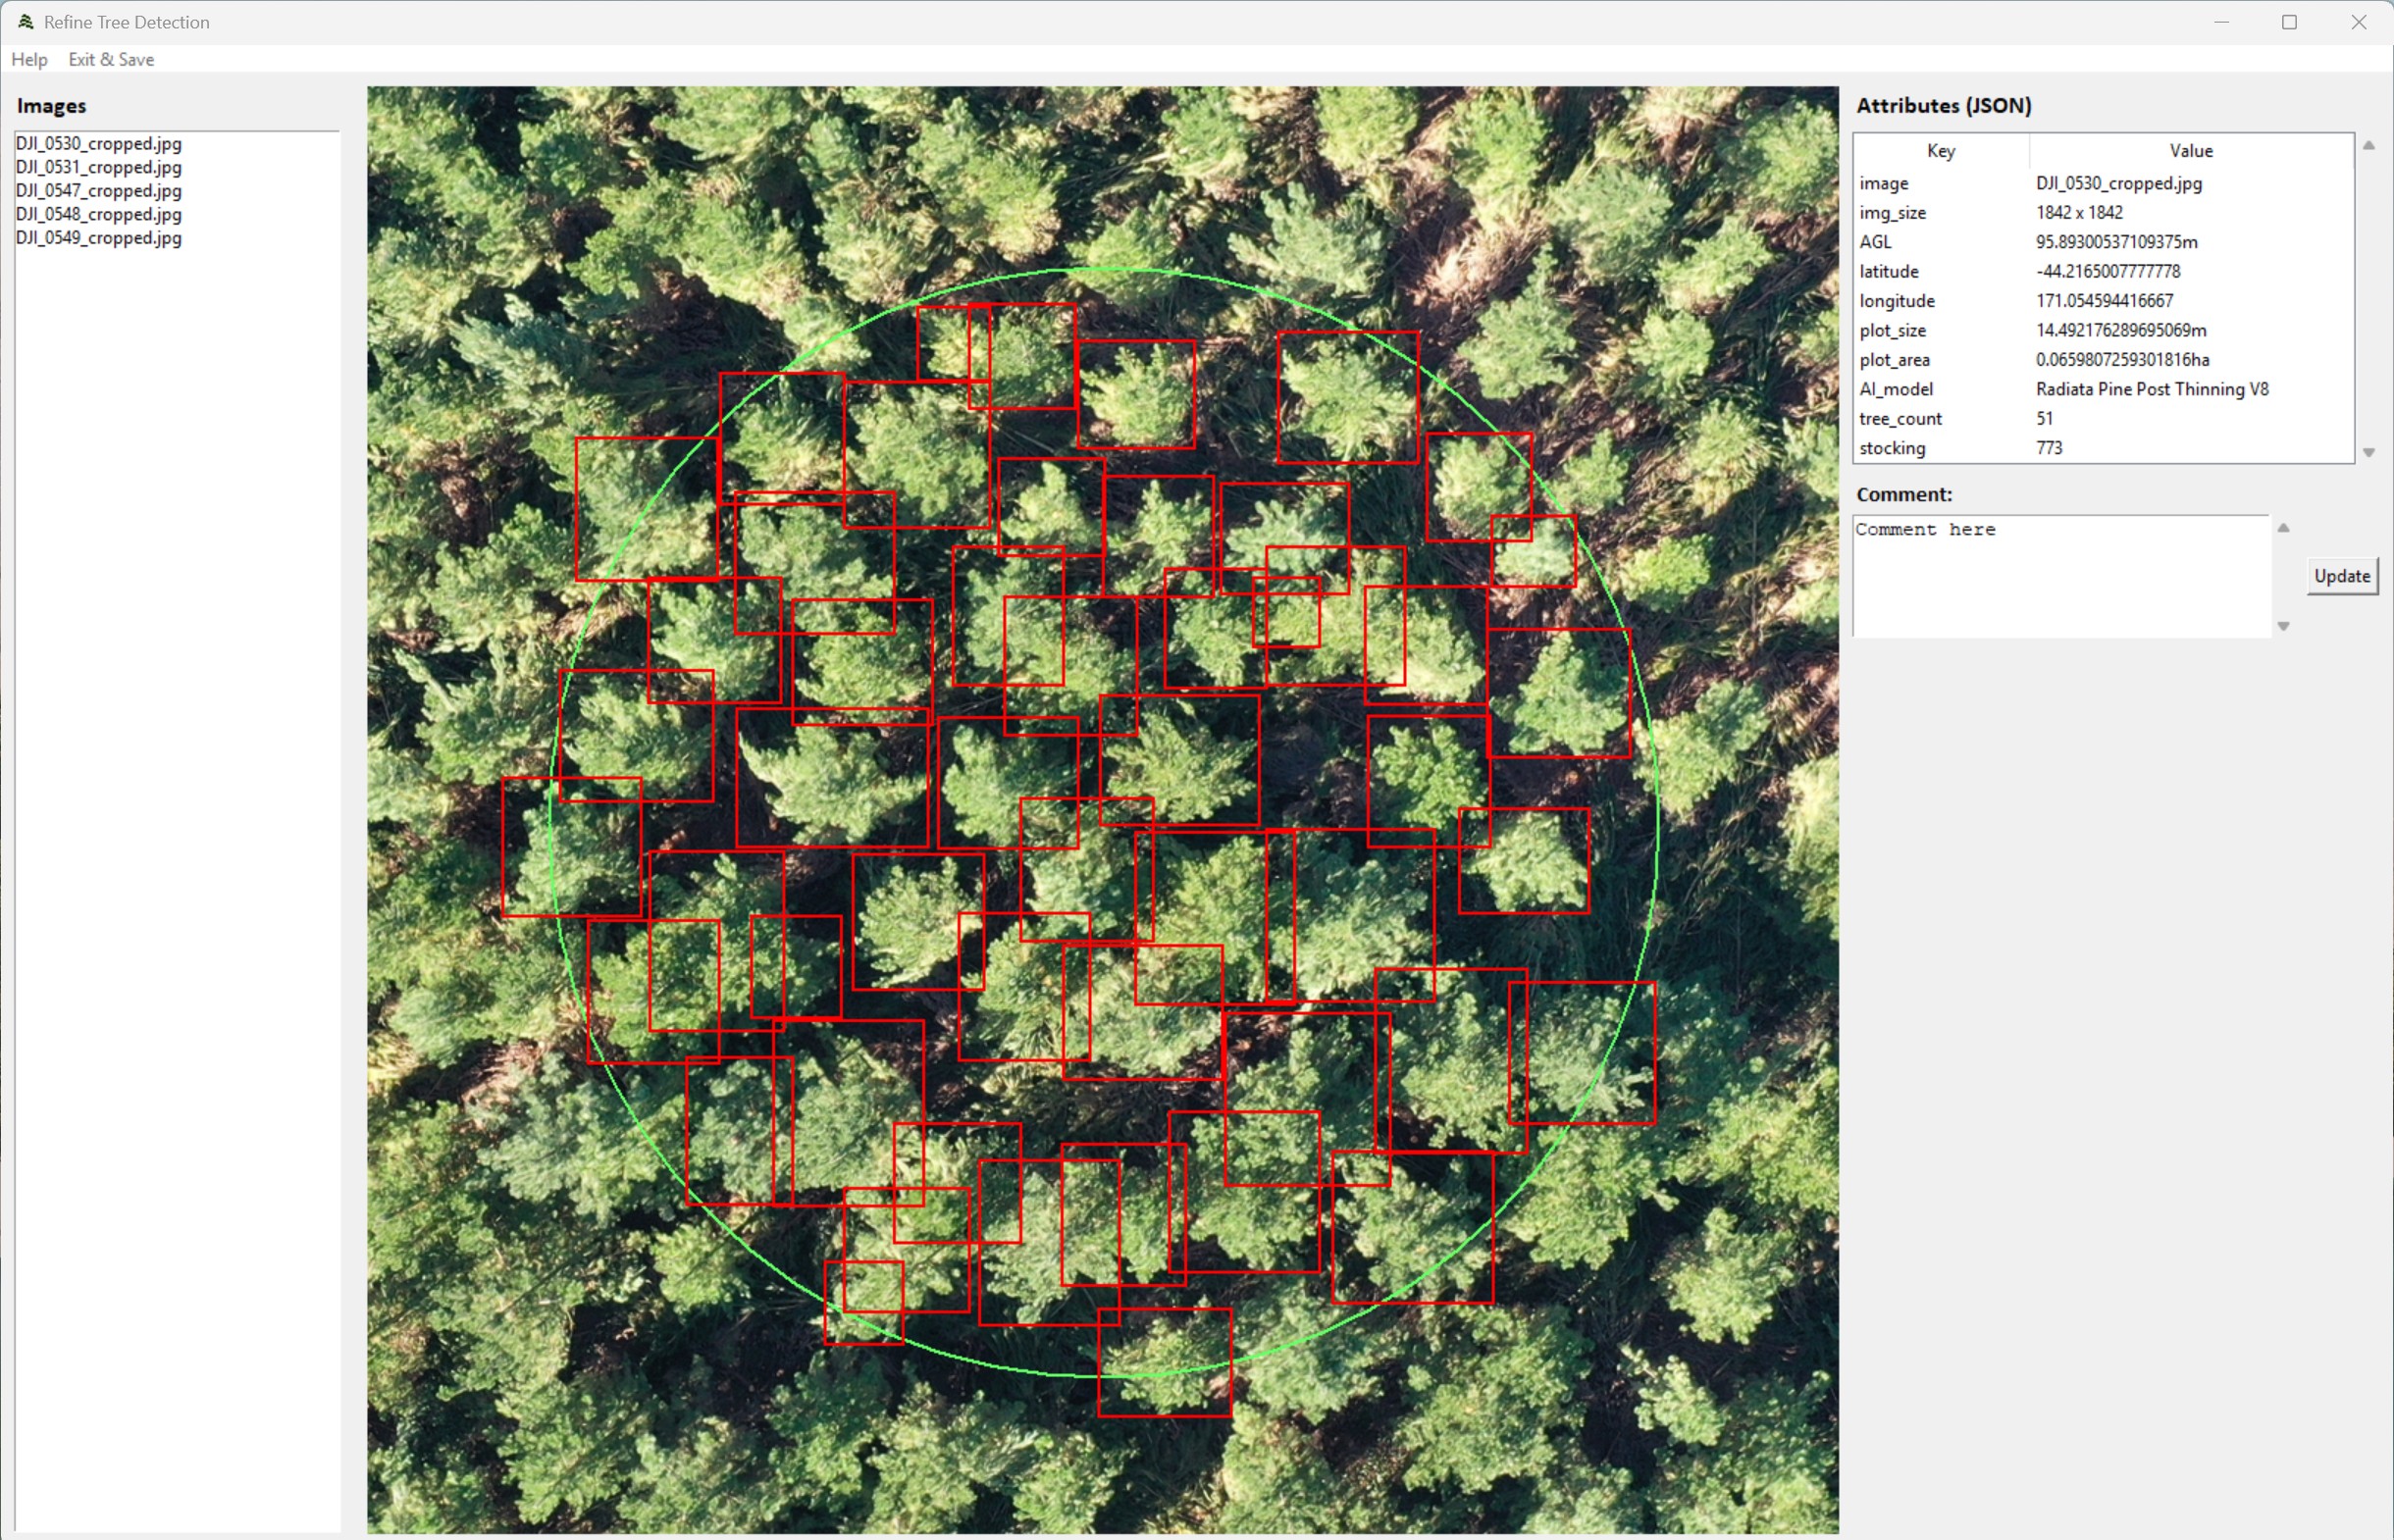
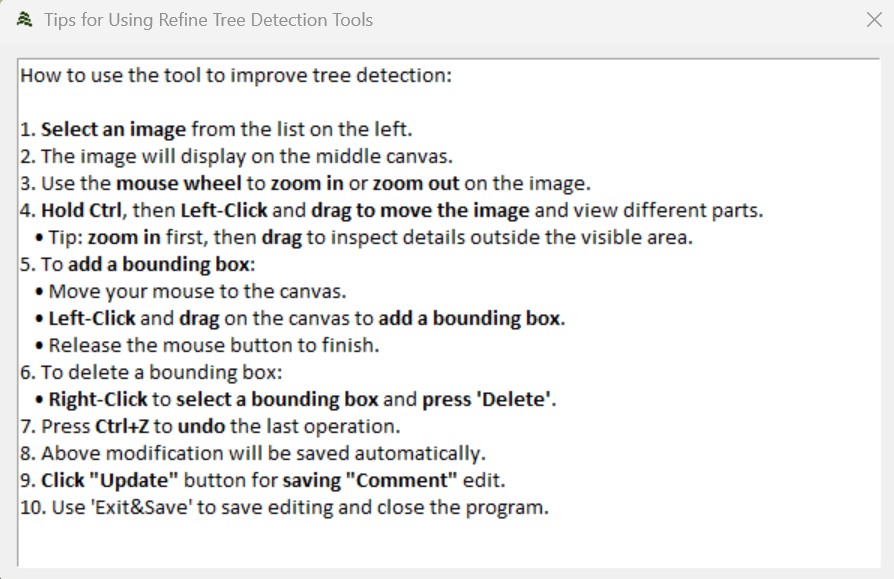
Users can also select help inside the Refine dialog, to see the workflow and hotkeys available when using the refine tool. Users can zoom and pan to help with selection and edits.
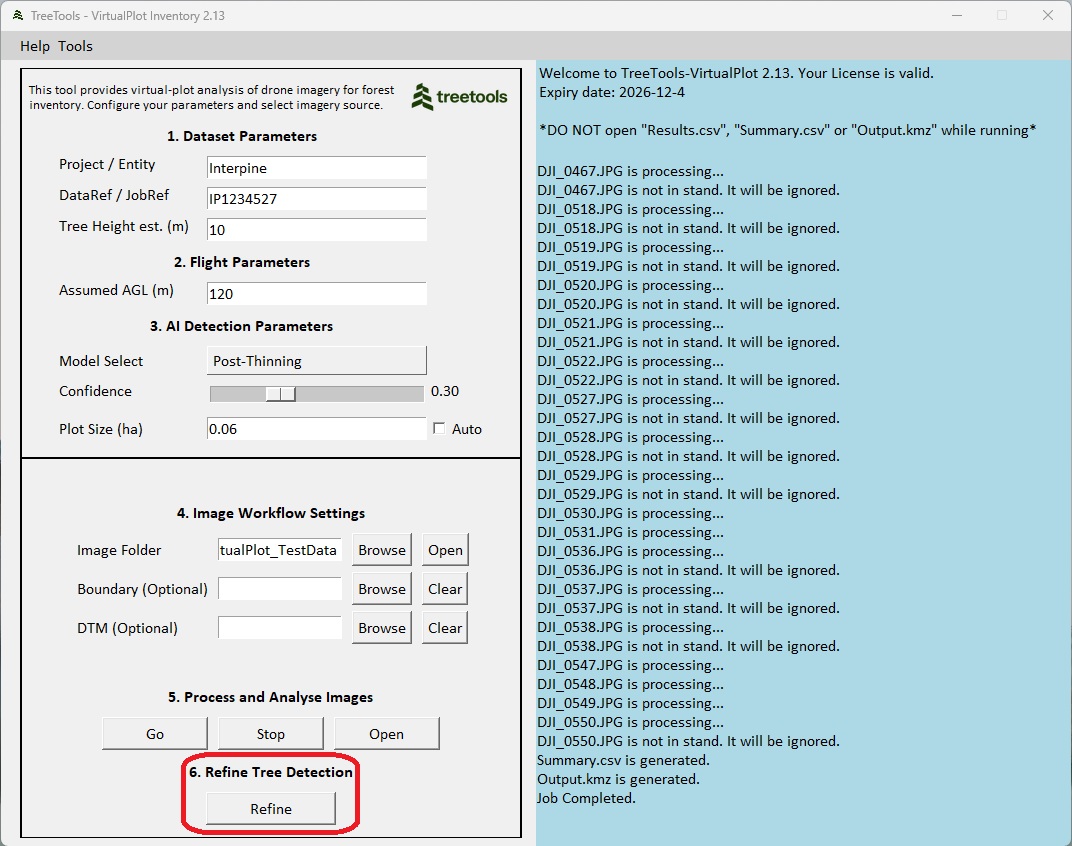
Results and Outputs
After the processing is complete, the following outputs and reporting is provided.
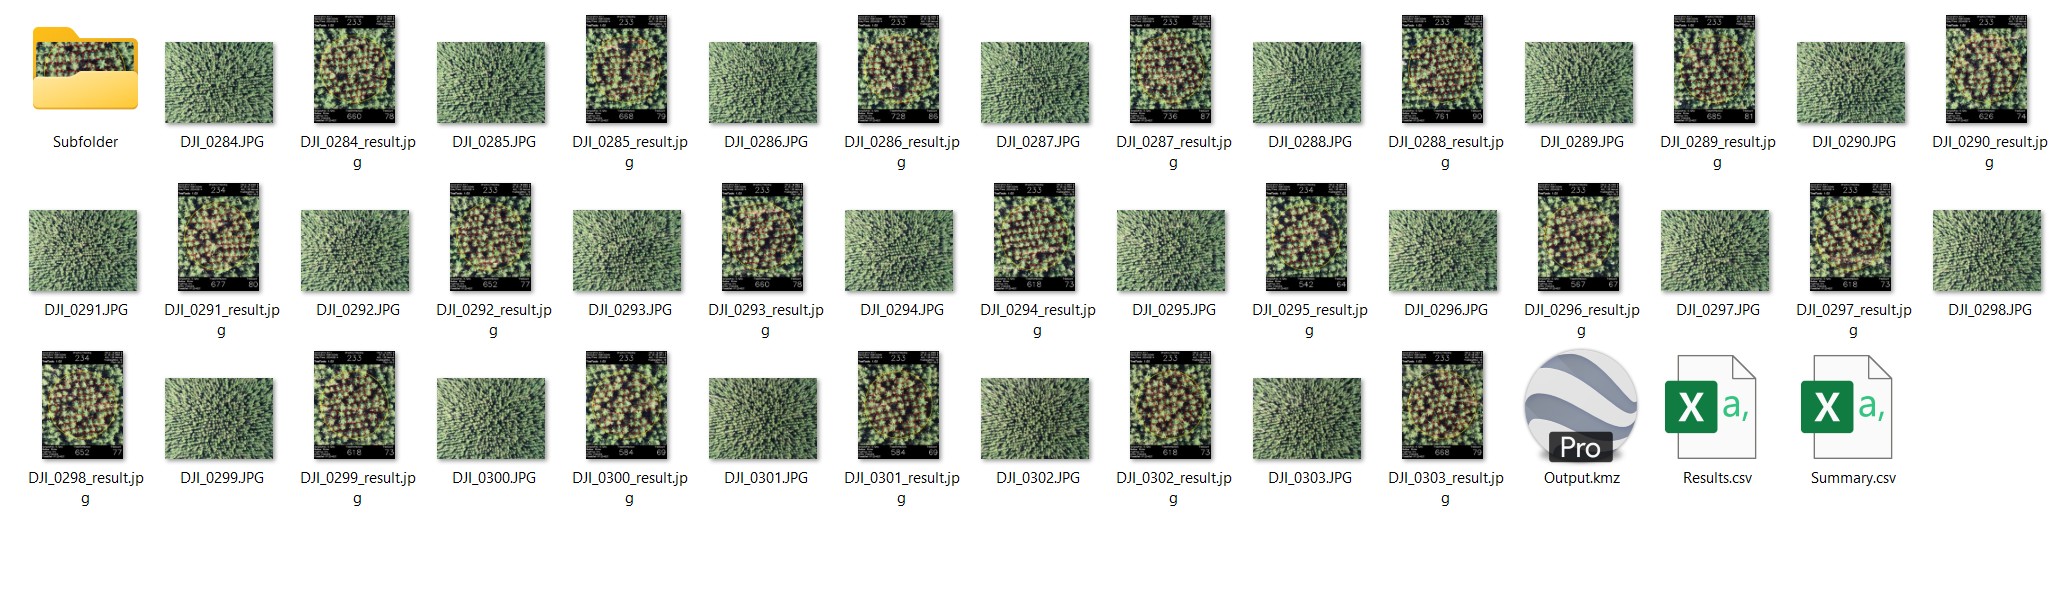
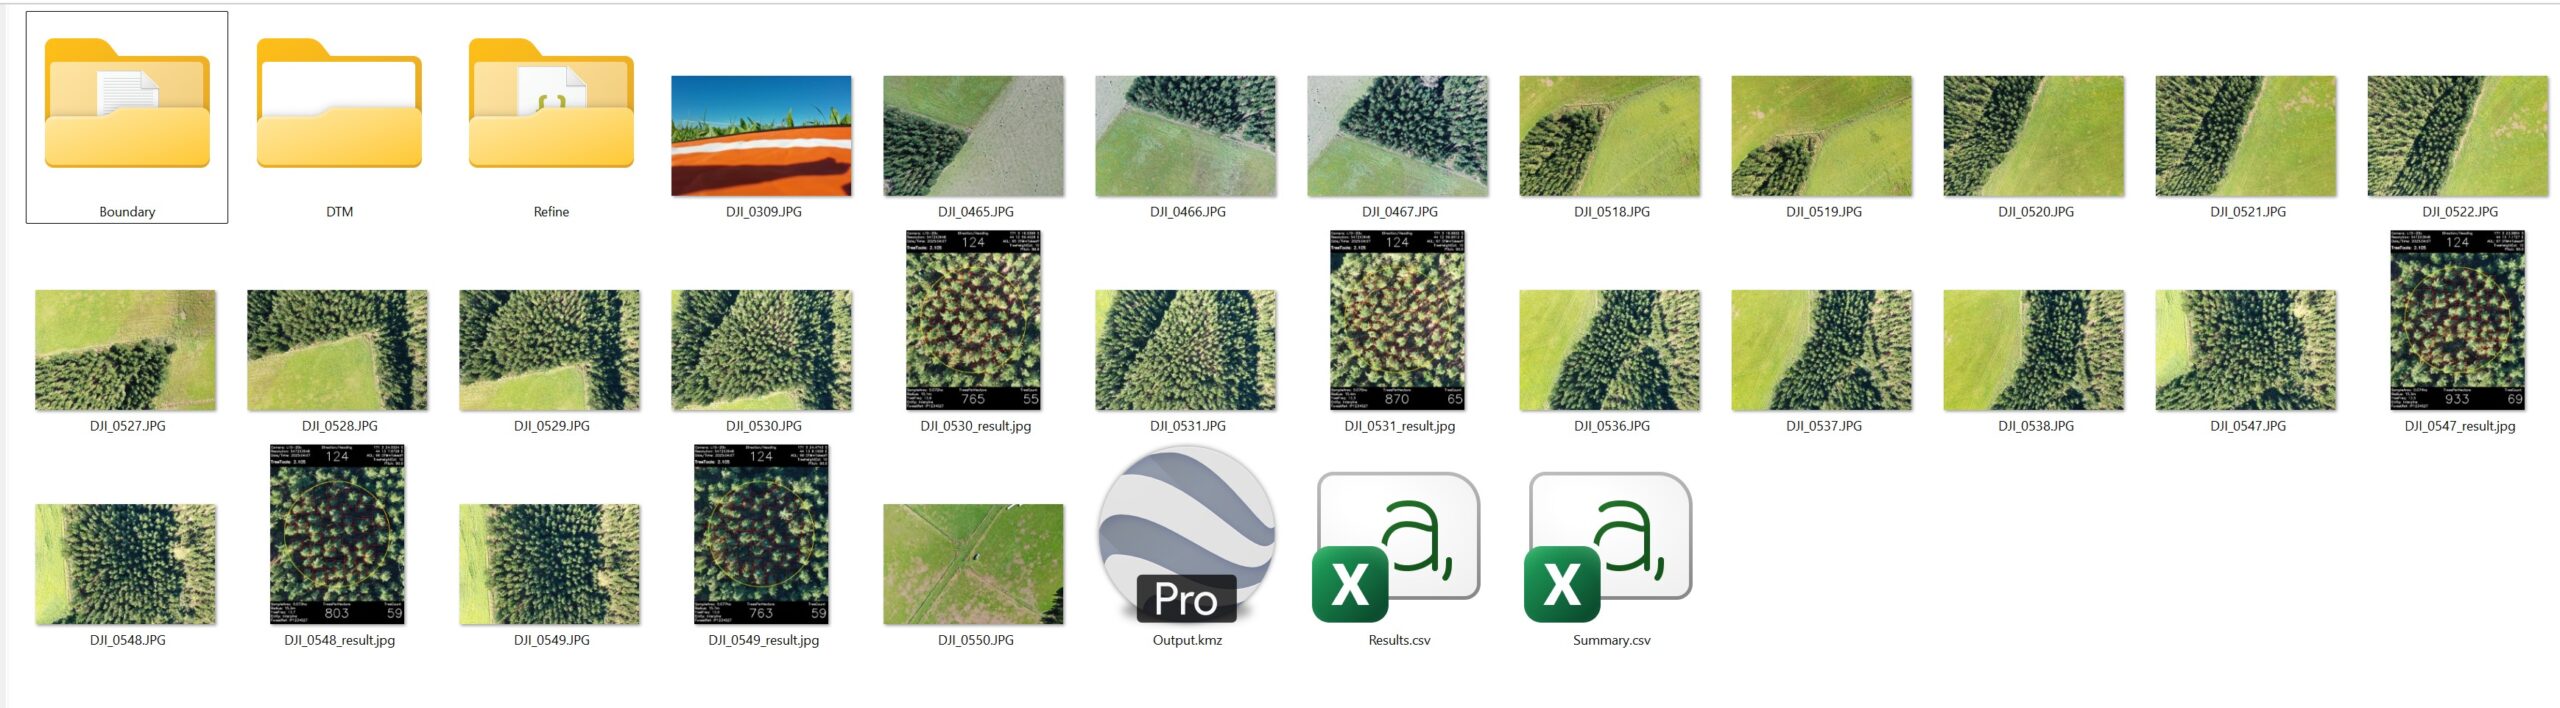
| Output | Description |
|---|---|
| Results.csv | Virtual plot listed for each image processed or selected for output. Includes attributes for each plot including tree count, stocking, and a range of input and analysis parameters. A full list of data types is available below. |
| Summary.csv | Contains the averages and statistical analysis for the folders/s processed. Includes statistics such as PLE (95% CI over the mean as a %), and an estimate of plots required to achieve 10% PLE. A full list of data types is available below. |
| Output.kmz | The KMZ file can be opened in Google Earth Pro and Avenza Maps to view the images in their spatial location. |
| <image>_result.jpg | In the source folder a output of each virtual plot is provided with the suffix “_result”. |
The output images for every submitted image can be double-checked manually to correct the stocking information. For example, if you find a missing tree in the yellow plot circle, then add a “TreeFreq” to the “TreesPerHectare” number for a correction to the stocking. On the other hand, if you find an area that is mistakenly marked as a tree but isn’t one, then subtract a “TreeFreq” from the “TreesPerHectare” number.
File Format: Results.CSV
| Field Name | Description |
|---|---|
| VirtualPlotVersion | Software version release. |
| Entity | Parameter Input: custom field input by user. |
| JobRef | Parameter Input: custom field input by user. |
| PhotoPath | Directory path of the input image. |
| DateTime | Date and time of the image taken. |
| Latitude | Latitude location of the plot center (degrees). |
| Longtitude | Longitude location of the plot center (degrees). |
| AiModel | AI model applied. Includes a version of model. This version number is considered independent from the VirtualPlot software as it relates to the iteration of the Ai model training. |
| Confidence | Confidence used for tree detection. |
| TreePerHectare | Tree count * TreeFreq representing tree per hectare. Trees per hectare is not the same as stems per hectare. Under NZ standard mensuration conventions, a tree with two stems below breast height will contribute twice as many stems as trees to the plot level per hectare estimate. |
| TreeCount | Tree count within the bounded plot area. A tree is considered to count towards the stocking if the tree crown is at least 50% within with the plot boundary. This is calculated by the center point of the detection square as represented on the virtual plot image. |
| SampleArea | Bounded plot size (hectares). |
| Radius | Radius of the bounded plot (meters). |
| TreeFreq | The number of trees per hectare represented by this tree. The frequency is calculated as 1/(plot area) and all trees have the same frequency. |
| Resolution | Pixel image resolution of the input image processed. |
| Pitch | Camera gimbal angle (degrees). |
| HAE | Height above ellipsoid (meters). |
| AGL | Altitude above ground level (meters). |
| AGLSource | AGL source (and therefore confidence). – Manual, just using the user provided default parameter value of assumed AGL, by default plot size and FoV will remain constant. – DTM, refers to use of the digital terrain model input file. Currently, 2.05 supports both NZVD2016 and Ellipsoidal vertical datums, and the horizontal coordinates could be NZTM2000 or WGS84. – DTM+Takeoff, refers to use of the digital terrain model input, whereby calculated height above ground based on the difference from a take-off image at the home point ground location. |
| TreeHeight | Parameter input: approx crop tree height (meters). |
| Orientation | Drone heading (degrees). |
| DTM | Filename of the DTM used. |
| VerticalDatum | Vertical Datum of the DTM |
| TakeOffImage | Filename of the Take-off Image used. |
| DroneModel | Drone model detected from the EXIF data. |
| CameraModel | Camera model detected from the EXIF data. |
| OverTopped | Binary value of overtopped, as defined by user during use of the “Refine Tree Detection Tool” Whereby if the plot is overtopped by a mature tree or if a mature tree falls within plot this also is considered stocked even when the user is unable to see or label any regenerating seedlings. (Only available for Hardwood Regen Assessment Model) |
| Stocked | Binary value of stocked. If (TreePerHectare > 0 or OverTopped = TRUE) then Stocked = TRUE. If neither condition is TRUE then Stocked = FALSE (Only available for Hardwood Regen Assessment Model). |
| VerifiedUnStocked | Binary value of VerifiedUnstocked, as defined by user during use of the “Refine Tree Detection Tool”. Whereby if the plot is unstocked, the user can select to define the plot as having manually confirmed as not having any target trees present. |
| InvasiveWeedsPresent | Binary value of InvasiveWeedsPresent, as defined by user during use of the “Refine Tree Detection Tool”. Whereby if the plot has invasive weeds the user can select to define the plot as having these present for reporting purposes. |
| Comment | Description and comment added manually by user |
File Format: Summary.CSV
| Field Name | Description |
|---|---|
| VirtualPlotVersion | Software version release. |
| Entity | Parameter Input: custom field input by user. |
| JobRef | Parameter Input: custom field input by user. |
| TotalImagesProcessed | Total images / virtual plots used to create the summary. |
| DateMinimum | Minimum date of data taken (as extracted from the EXIF image data) |
| DateMaximum | Maximum date of data taken (as extracted from the EXIF image data) |
| Stocked | The number of plots classified as Stocked (Only available for Hardwood Regen Assessment). |
| OverTopped | The number of plots classified as overtopped (Only available for Hardwood Regen Assessment). |
| VerifiedUnStocked | The number of plots classified as VerifiedUnStocked. |
| InvasiveWeedsPresent | The number of plots classified as InvasiveWeedsPresent. |
| AverageTreesPerHectare | Average of the Tree count * TreeFreq representing tree per hectare for each image processed. Trees per hectare is not the same as stems per hectare. Under NZ standard mensuration conventions, a tree with two stems below breast height will contribute twice as many stems as trees to the plot level per hectare estimate. For Hardwood Regen Assessment Model, overtopped plots are excluded in the average calculation. |
| TPH_SD | Trees per hectare standard deviation |
| TPH_CI95 | Trees per hectare 95% confidence interval. |
| TPH_PLE | Trees per hectare probable limit of error %. This being the 95% confidence interval divided by average trees per hectare represented as a %. |
| PlotsToReach10PctPLE | Estimated additional images / virtual plots required to reach a PLE of 10%. Will show zero where PLE is already below 10%. |
| StockingTarget | Target stocking specified in the input parameters. |
| StockingTolerance | Stocking tolerance specified in the input parameters. |
| StockingLowPct | Percentage of plots with stocking < (StockingTarget – StockingTolerance) |
| StockingTargetPct | Percentage of plots with stocking between (StockingTarget – StockingTolerance) to (StockingTarget + StockingTolerance) |
| StockingHighPct | Percentage of plots with stocking > (StockingTarget + StockingTolerance) |
Importing Results to ArcGIS Pro
Use the “XY Table to Point” layer option to import the results.csv file for display in ArcGIS. This will provide display and conversion to feature layer.
Importing Results to GeoMaster
Import into GeoMaster using the Inventory Import function from the Tools menu. Select the relevant Job Number field to link the inventory results to during the import.
Importing Output.kmz to Google Earth
The Output.kmz file will in Google Earth Pro for seamless display. The plot imagery is embedded for ease of review across the survey area.
Importing Output.kmz to Avenza Maps
You can import the Output.kmz into Avenza Maps for seamless use in the field. The plot imagery is embedded for ease of review across the survey area.
More Information
Here is some additional information for those keen to understand more.
What precision is expected in the measurement of horizontal plot area when using Virtual Plot?
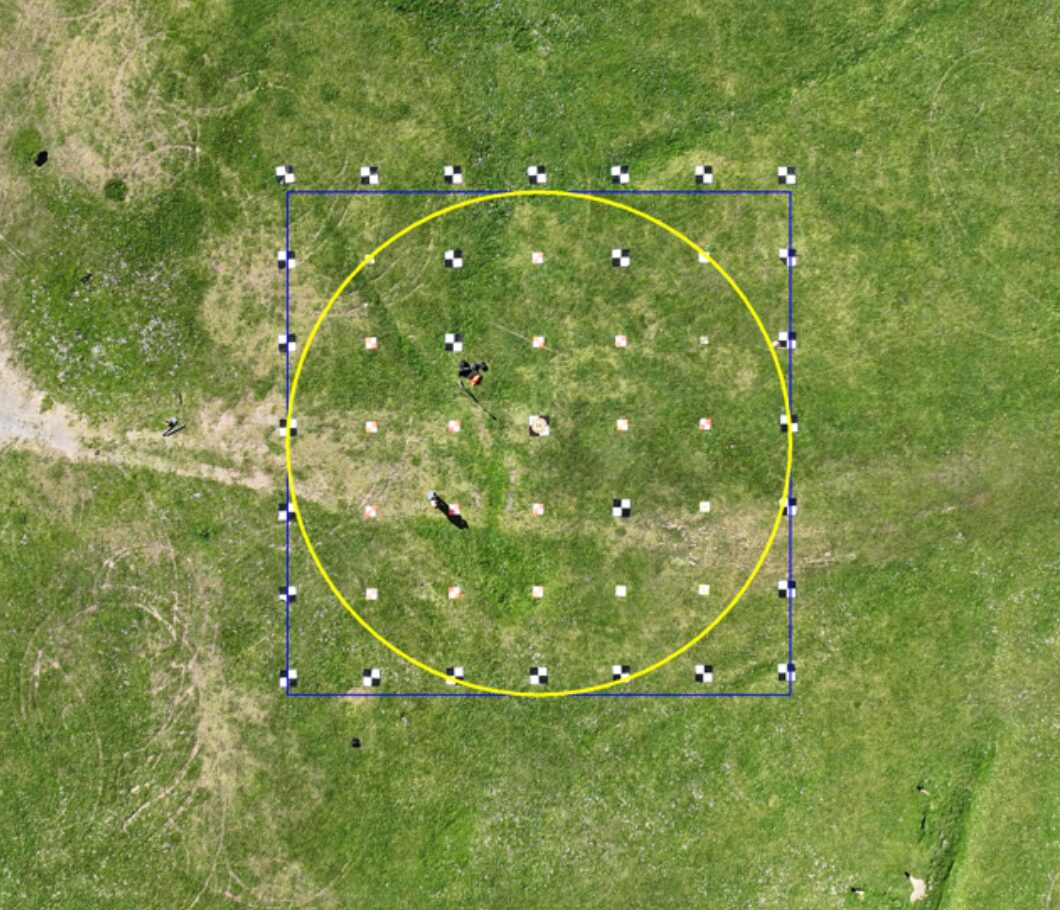
Precision of the area measurement relies on the height above ground measurement, and calibration of the drone camera sensors FoV. The drone’s altitude is derived from the GNSS heights stored within each photo’s EXIF data. For drones using a RTK GNSS, the altitudes recorded are often with 5-15 centimeters and therefore will be the most precise for area measurement. Repetitive testing has been completed on a range of drone sensors using the test field layout as pictured below. This provides for refined custom FoV calibration for supported list of drones as well as the repetitive testing of altitude variation and the impact on area assessment completed 10 times per sensor. The results are shown below for some of the common drones used. This consistently shows error less than 2% for area assessment, and RTK GNSS enabled being 0.5%.
Typical Area Measurement Error Expected from Field Calibration Trials
| AGL (m) | DJI Mavic 3E (RTK) | DJI Mavic 3E | DJI Mavic 2 | DJI Phantom 4 Pro |
|---|---|---|---|---|
| 120 | +/- 0.5% | +/- 1.0% | +/- 0.8% | +/- 1.6% |
| 100 | +/- 0.4% | +/- 1.9% | +/- 1.0% | +/- 1.3% |
The AGL above ground is then determined by the quality and use of the digital terrain model. We recommend use of a DTM during analysis and have workflows for both older and newer drones to enable users to load a DTM. This will ensure the precision of the AGL is optimized for the site.
Tree stocking per hectare validation results?
The objective of the project is to gather more imagery from users to better train the Ai detection models. Therefore, as more Ai Models are trained and developed users will experience improvements in the model precision. Here is a snapshot of some of the field trials and client feedback. We will add to this over time and also welcome your own feedback.
Field Trials – Dec 2024. These results were using VirtualPlot V2.01, and Ai Model: Radiata pine Thinning Assessment V2.
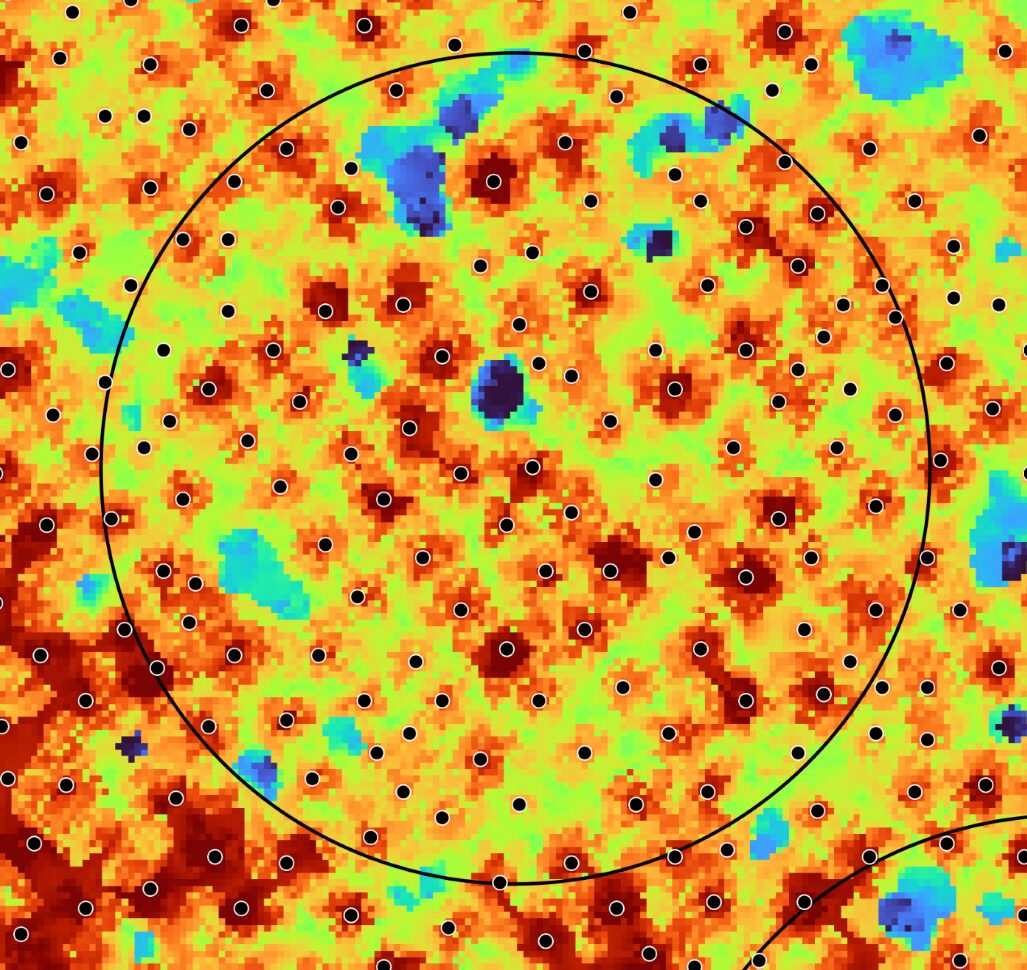
Images were capture by a DJI Phantom 4. The camera FoV did not have a custom calibration. The model was not trained with images from this dataset. The flight height was noted by client as 120m, flat flight over the stand and not terrain following. A DTM was not used during the analysis. This stand predominately flat, but some minor variation terrain (+/-10m). In addition, based on the LiDAR data result the average tree height in this stand is around 11m. Therefore, with these parameters the radius of the yellow circle is calculated as 19.2m. The site has recent LiDAR over the stand.
This radius was compared with the real distance based on the LiDAR analysis. After analyzing 10 virtual plots, radius measurement error was = 19.2 ± 0.31 m. Therefore, the error for the area provided could be ±3.2%.
30 virtual plots were compared for tree detection performance. These two tables show the analysis results.
Confusion Matrix
| True Positives | False Positives | False Negatives |
|---|---|---|
| 2258 | 0 | 52 |
Performance Matrix
| Precision | Recall | F1 Score |
|---|---|---|
| 1 | 0.977 | 0.989 |
Finally, combining the tree detection error and virtual plot area error, the stocking error is estimated as ±5.5%. Our goal is to keep the stocking error below 10% under normal conditions, so the result in this stand is acceptable.
From this trial improvements with guidance around terrain awareness flights and processing with the DTM, and improvements in detection Ai models have been implemented.
The AGL above ground is then determined by the quality and use of the digital terrain model. We recommend use of a DTM during analysis and have workflows for both older and newer drones to enable users to load a DTM. This will ensure the precision of the AGL is optimized for the site.
Client Trial Jan 2025 Using VirtualPlot V2.01, and Ai Model: Radiata pine Thinning Assessment V2.
Waste thinning block, mixed terrain flown using terrain following using a Phantom 4 Pro using Map Pilot. Manual review of the tree detections showed on average 1.8 trees per plot missed Ai detection. The largest was 7 in one plot. It was simple to revise and review with the Tree Frequency provided on each image, allowing for adjustment to the stocking estimates and the average changed from 270 SPH prior to manual review to 287 SPH after. (+6.2%). This data was then used to improve and release a new Ai Model.
Client Trial Jan 2025 Using VirtualPlot V2.01, and Ai Model: Radiata pine Thinning Assessment V2.
Using a Mavic 3E, waste thinning block, steep terrain. Initially the client presumed they has used a terrain awareness flight of 120m AGL, but noted they had downloaded the DTM from LINZ website in WGS84 format. On review this was still in NZVD2016 height datum and therefore the flight was actually flown more like 106m AGL. Local variation in the steep terrain also shown the benefits of also including the 1m DTM in the analysis with actual AGL ranging from 90-110m due to gullies and ridges which were smoothed out by the flight planning software. Once processed with the DTM loaded into VirtualPlot the results were very close to expected and manual plotting operations. The client was also impressed at the Ai detection with very little if any trees missed and the native species in some areas not being detected, and excluded from the stocking counts.
Further Support
Thanks for using TreeTools VirtualPlot.
We wrote these articles to equip you with everything you need to get the job done on your own, but we understand that sometimes this isn’t sufficient.
If you’re stuck, the TreeTools team will be able to help. Contact us here.