Unlock the Future of Tree Thinning Assessment
TreeTools SilvaCloud
SilvaCloud leverages LiDAR Data to provide rapid and accurate stocking assessments at the stand level in your forest.
Key Features

Streamlined Data Processing
SilvaCloud is easy to use and is compatible with a range of data sources. Users can leverage publically available LiDAR data from opentopography.org, or data from dedicated airborne or UAV platforms.
Actionable Data
SilvaCloud provides spatial data based stocking estimates for thinning machines and operators to use in field.
This example shows low, medium, high stocking with an estimate of the total trees per grid cell (25x25m) and an estimate of the tree to be removed to meet the thinning prescription shown in brackets.

SilvaCloud Outputs
Digital Elevation Model (DEM)
Spatial representation of ground height in your area of interest. This is derived from the LiDAR data supplied to SilvaCloud. The DEM enables you to understand the topography (height, aspect, slope) in the area. 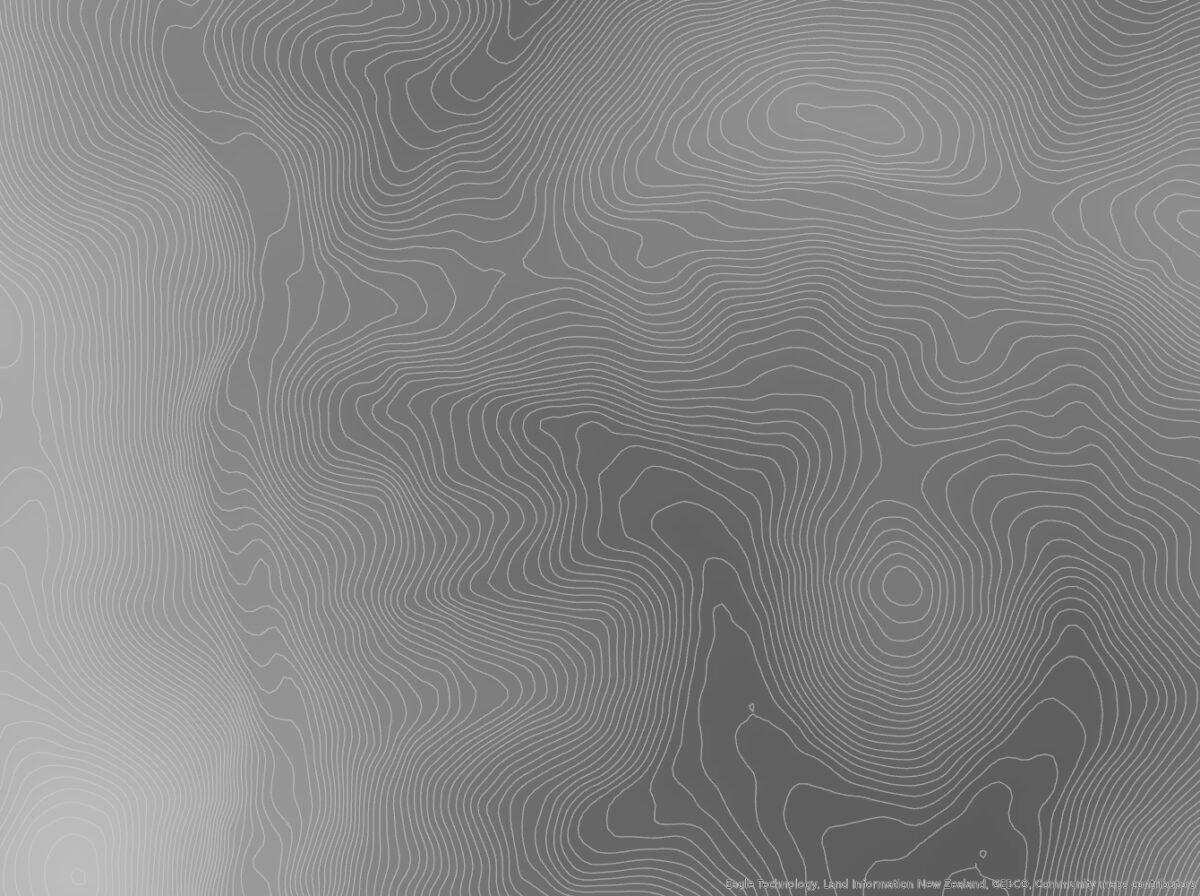
Canopy Height Model (CHM)
Spatial representation of tree height in your area of interest. This is derived from the LiDAR data supplied to SilvaCloud. The CHM enables you to understand variations in individual and stand level tree heights.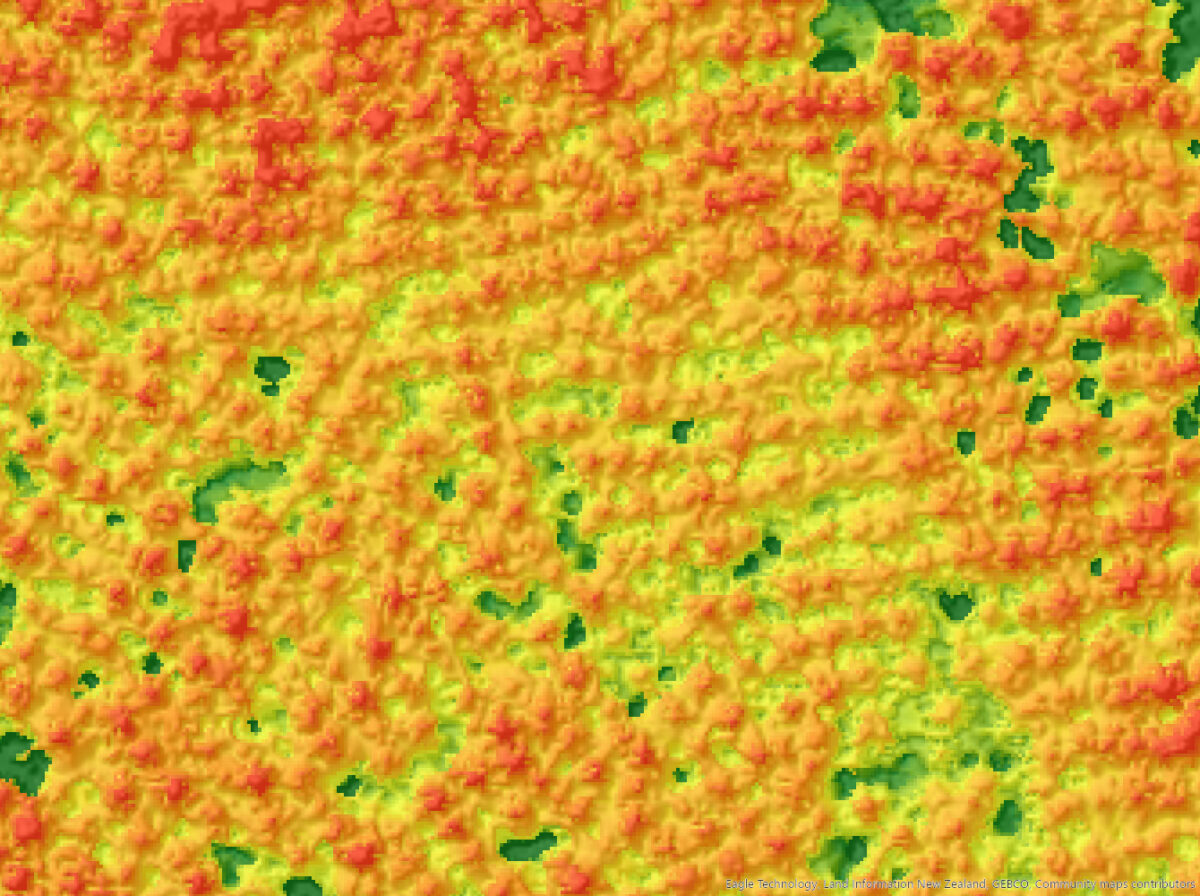
Tree Crowns
Spatial representation of the crown for each tree in your area of interest. The tree crown data enables individual trees to be delineated, and gaps to be detected.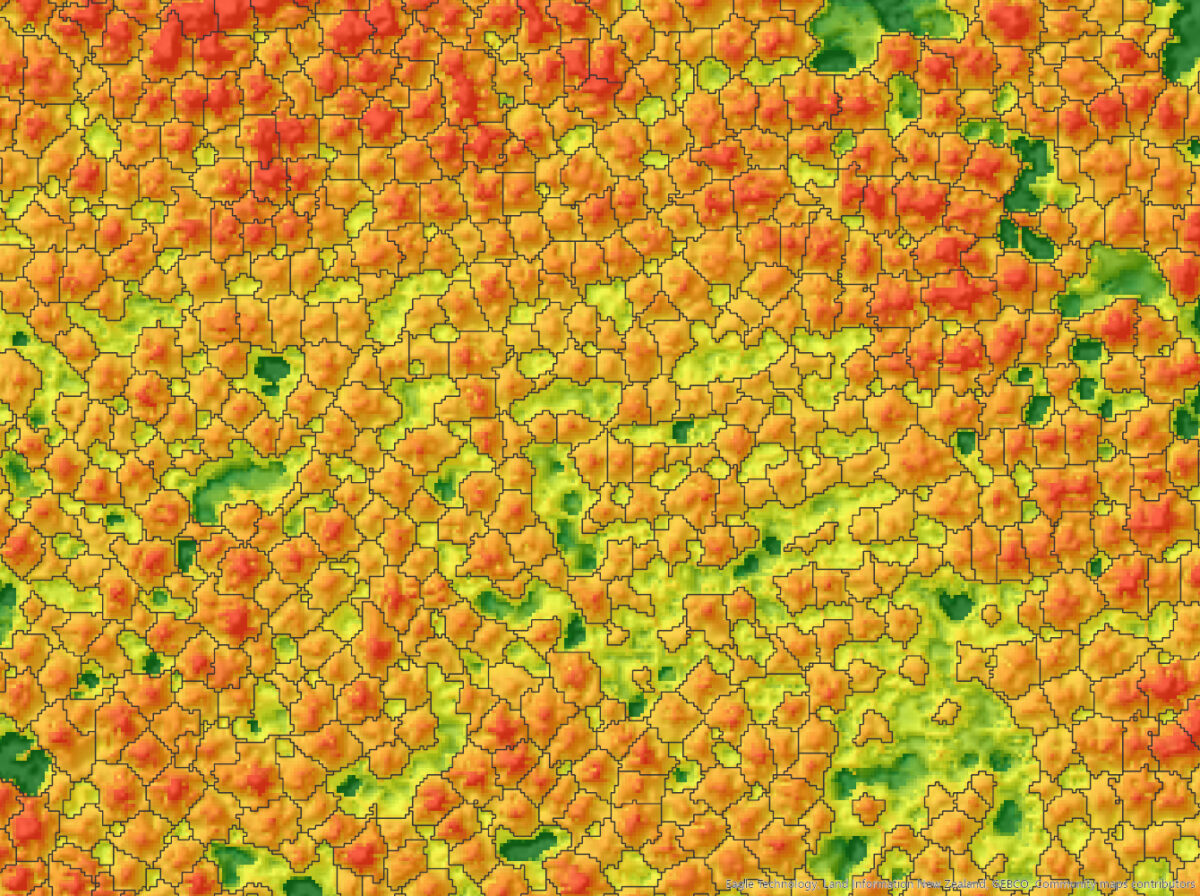
Tree Locations
Spatial representation of tree locations in your area of interest. The tree location data marks the highest point within each crown and is the basis for subsequent stocking analysis. 
Tree Heights
Spatial representation of individual tree heights in your area of interest. The tree height is an attribute of the tree peak shapefile and allows metrics such as mean top height to be calculated at the stand level.
Stocking (SPH)
Spatial representation of forest stocking in your area of interest. The stocking data takes the form of a 25 x 25m grid over the stand and displays the stocking as stems per ha.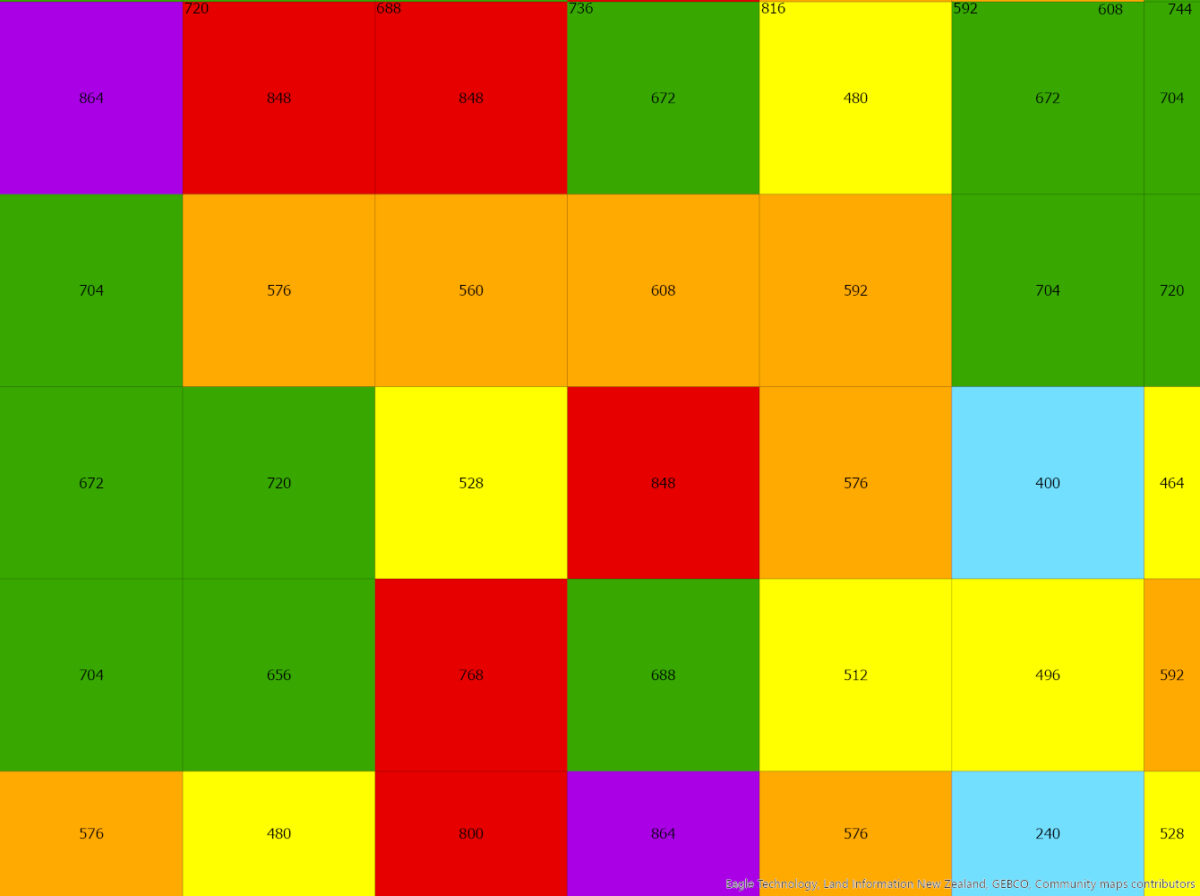
Getting Started with Our Software
Step-by-Step Guide
1
Prepare LiDAR Data
2
Submit Data for Analysis
Upload your data as a ZIP file. Leave the heavy lifting to us and we will email you when your data is ready to download.
3
Review in GIS
Load the data into your own forest information systems for analysis and mapping.

Frequently Asked Questions
How do I download LiDAR Data from LINZ?
Follow our tutorial on how to download data from the LINZ Data Service or Open Topography to access public LiDAR datasets.
How long will it take to get results?
Data processing can take 4-12hrs depending on the amount of data and the demand on our servers.
How big of an area can I get analysed?
SilvaCloud will take a maximun file size of 3GB.
Does TreeTools offer cloud synchronization?
Yes, TreeTools supports cloud synchronization to ensure your data is accessible from anywhere.
Can I customize SilvaCloud to fit my needs?
TreeTools offers various customization options. Refer to our customization guide in the tutorial section for more information.
What should I do if I encounter a problem with SilvaCloud?
Consult our troubleshooting guide available in the Tutorial section or contact our support team for assistance.